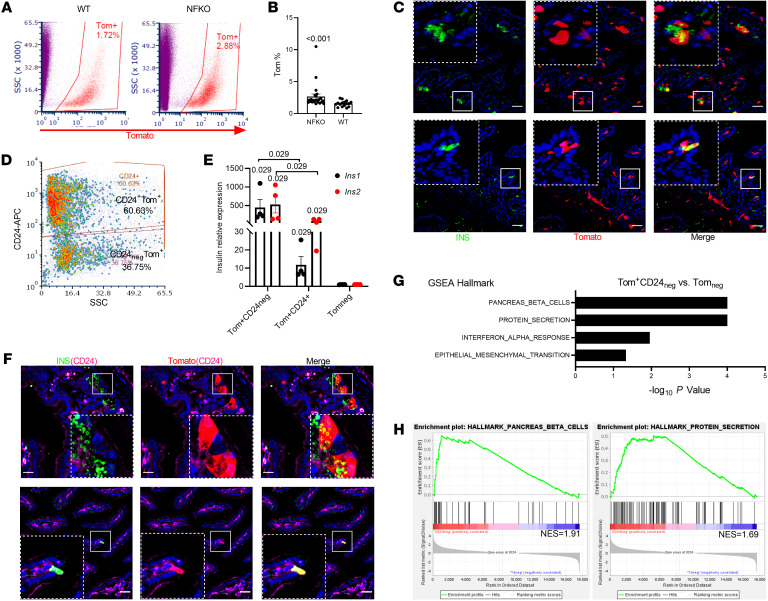
Figure 2. Expanded Neurog3 lineage and β-like cells in gut of Neurog3 FoxO1-KO mice.
(A) FACS of isolated Tomato+ cells from either Neurog3Cre+FoxO1fl/fl; ROSAtdTomato (NFKO) or Neurog3Cre+; ROSAtdTomato (WT) gut epithelial cells. Red gate indicates sorting window for Neurog3-derived Tomato+ cells. (B) Tomato+ cell frequency assessed by FACS in NFKO and Neurog3Cre (WT) mice (NFKO, n = 23; WT, n = 16 mice). Data are represented as mean ± SEM. Two-tailed t test. (C) Representative IHC images of 2 types of Neurog3-derived β-like cells from NFKO mice: Paneth pattern (upper panel) and EEC pattern (lower panel). Scale bars: 40 μm. (D) FACS plot of CD24-based sorting strategy of dissociated Tomato+ single cells from NFKO small intestinal epithelial cells. SSC, side scatter. (E) Ins1 and Ins2 mRNA in sorted CD24+Tomato+, CD24negTomato+, and Tomatoneg populations (n = 4 mice, Mann-Whitney rank-sum test). (F) Representative IHC of insulin, CD24, and Tomato. Paneth (upper panels) and EEC pattern (lower panels) of CD24 staining in insulin+ cells (green and red channel double colocalization is shown in yellow; green, red, and magenta triple colocalization is shown in white). (G and H) Enriched hallmark gene sets in CD24negTomato+ versus Tomatoneg population predicted by the GSEA.

