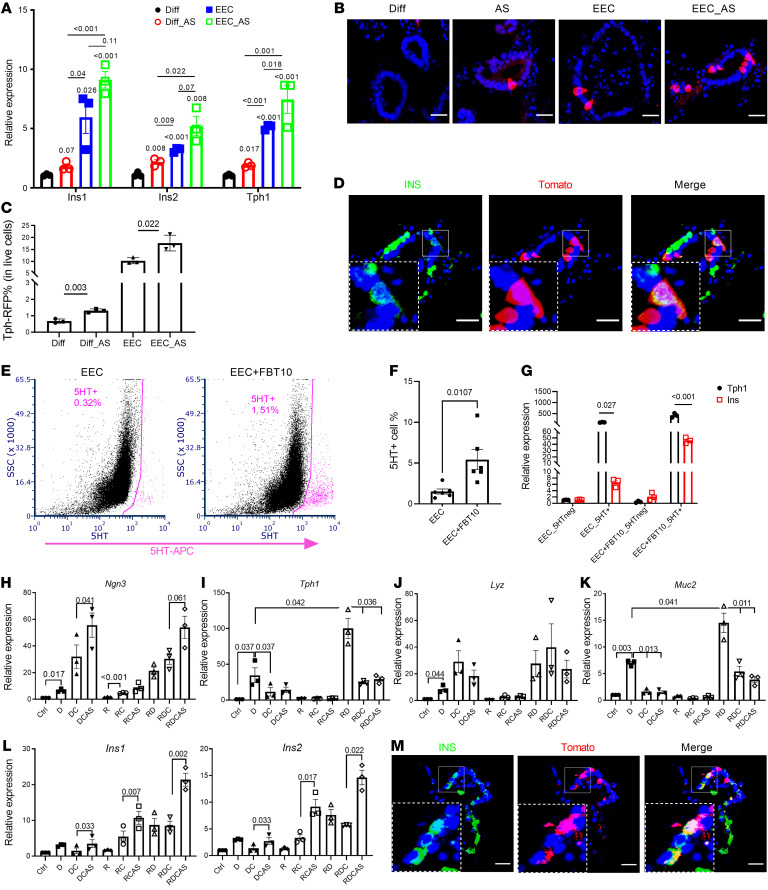
Figure 3. Dual source of β-like cells in murine and hGOs.
(A) QPCR of mouse intestinal organoids following EEC induction. n = 3 independent experiments. Data are represented as mean ± SEM. Paired t test. (B) Tomato staining of Tph1CreERT2 organoids after 4 days in differentiation (Diff) and EEC induction medium following activation of Tomato reporter. n = 3 independent experiments. Scale bars: 20 μm. (C) Percentage of Tph1CreERT2 Tomato cells in mouse GOs with or without iFOXO1 (AS) treatment (n = 3 independent experiments). (D) Lineage tracing of Tph1CreERT2 4 days after activation of Tomato expression. Scale bars: 20 μm. (E) FACS diagram representing the sorted 5HT+ (pink) population in EEC induced from hGOs with or without FBT10 treatment. (F) Percentage of 5HT+ cells in EEC induced from hGOs with or without FBT10 treatment. n = 6 independent experiments. Data are represented as mean ± SEM. Two-tailed t test. (G) QPCR of Ins and Tph1 in sorted 5HT+ cells with or without FBT10 treatment. n = 3 independent experiments. (H–L) QPCR of different marker genes following treatment with combination of iNotch (DAPT [D]), iTGF-β (Repsox [R]), iGSK3β (Chir [C]); and iFOXO1 (AS). n = 3. Data are represented as mean ± SEM. Paired t test. (M) Lineage tracing of Lyz1CreER 4 days after activation of Tomato expression. Scale bars: 20 μm.

