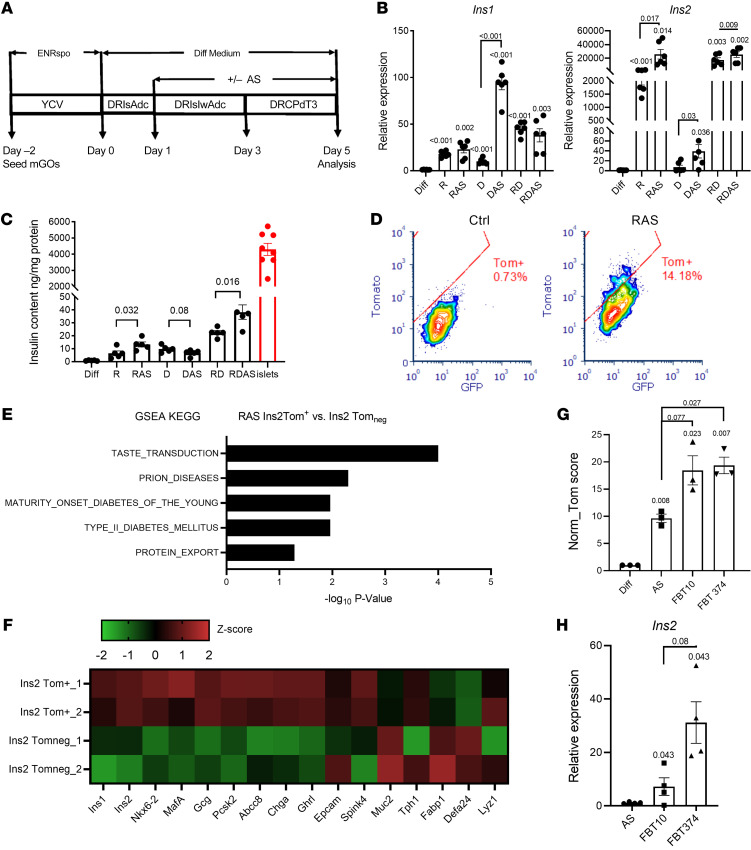
Figure 4. Conversion of gut cells into insulin-producing cells by combination treatment.
(A) Modified differentiation protocol to induce conversion of INS+ cells by the addition of FOXO1 inhibitor to the differentiation medium at different stages. Treatment details are explained in Quantitative measurement of conversion insulin-producing cells with cultured organoids in Supplemental Methods. ENRspo, organoid growth medium epidermal growth factor/Noggin/R-spondin; Y, Y-27632; C, CHIR99021; V, vaproic acid; D, DAPT; R, Repsox; Is, ISX-9; Adc, 5-Aza-2′-deoxycytidine; Iw, IWP2; Pd, PD0325901; T3, thyroid hormone. (B) QPCR of Ins1 and Ins2 expression from organoids following treatment with the differentiation cocktail, comprising inhibitors of Notch (DAPT [D]) and/or TGF-β (Repsox [R]), followed by the addition of FOXO1 inhibitor (AS). n = 6 independent experiments. Data are represented as mean ± SEM. Paired t test. (C) Insulin content in organoids following treatment with the differentiation cocktail compared with islets. n = 4 independent experiments. Data are represented as mean ± SEM. One-way ANOVA. (D) FACS diagram presenting the percentage of converted INS2+ cells in control versus differentiation cocktail-treated organoids. (E) Upregulated KEGG pathways in sorted INS2-Tom+ cells versus INS2-Tomneg cells. (F) Heatmap comparing expression levels of typical islet and gut epithelial marker genes in sorted INS2-Tom+ versus INS2-Tomneg from differentiated organoids of INS2-Tomato mice. (G) Comparative evaluation of the potencies of 2 new FBT compounds and iFOXO1 (AS) to generate insulin+ cells by an integrated calculation (Tom score) of INS2-Tomato intensity, percentage of INS2-Tomato cells, and live-cell percentage, as detected by flow cytometry. n = 3 independent experiments. Data are represented as mean ± SEM. Paired t test. (H) Ins2 relative expression in sorted INS2-Tomato cells. n = 4 independent experiments. Data are represented as mean ± SEM. Paired t test.

