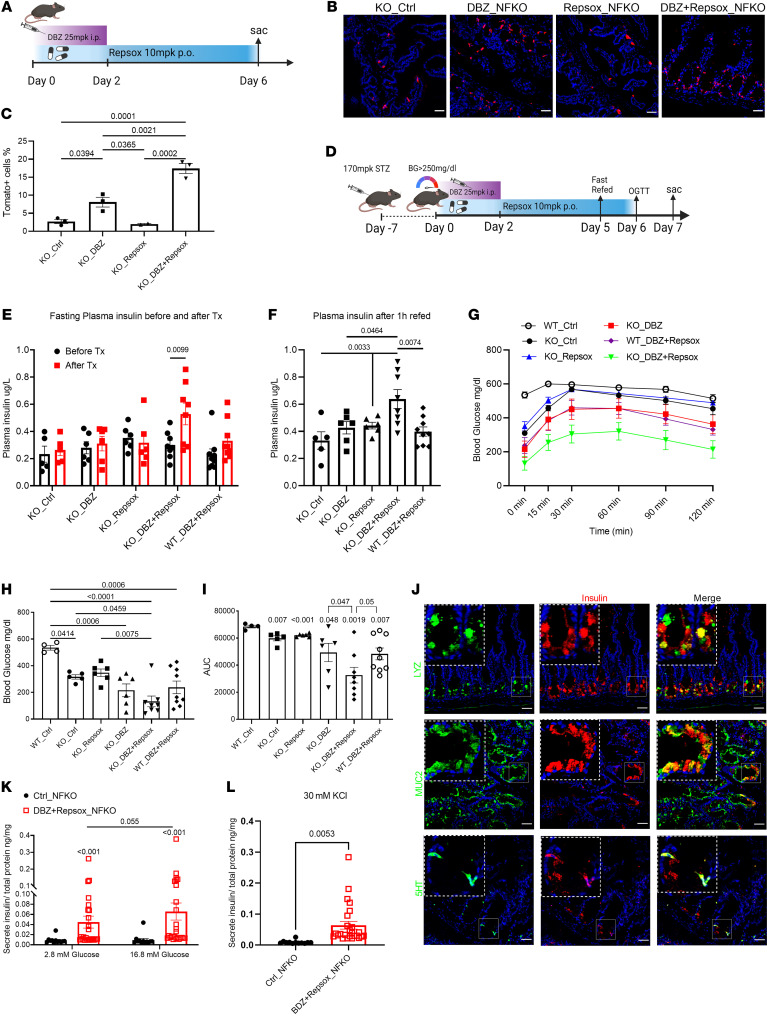
Figure 5. iNotch and iTGF-β combination therapy generates insulin+ cells in NFKO mice.
(A) Experimental design for DBZ and Repsox combination treatment of NFKO mice. (B) Representative IHC images of Tomato (red) staining in Neurog3Cre FoxO1fl/fl; ROSA tdTomato mice following DBZ, Repsox, or combination treatment. Scale bars: 40 μM. (C) Tomato+ cell frequency measured by FACS in control, DBZ-, Repsox-, or combination-treated Neurog3Cre FoxO1fl/fl; ROSA tdTomato mice. n = 3 mice in each treatment group. Data are represented as mean ± SEM. Two-way ANOVA. (D) Experimental design for DBZ and Repsox combination treatment in STZ-WT or NFKO mice. (E) Four-hour fasting plasma insulin levels in STZ-NFKO and STZ-WT mice before and after treatment with the indicated compounds. (F) One-hour refed plasma insulin levels in STZ-NFKO and STZ-WT mice before and after treatment with the indicated compounds. (G) OGTTs after DBZ, Repsox, and dual treatment. (H) Four-hour fasting glucose level measurements before OGTT. (I) AUC of OGTT shown in G. (J) Representative IHC images of lysozyme (upper panels, green), MUC2 (middle panels, green), and 5HT (lower panels, green) costained with insulin (red) in combination therapy–treated STZ-NFKO mice. Scale bars: 40μm. Green and red channel colocalization shown in yellow. n = 6 to 9 mice in each treatment group. Data are represented as mean ± SEM. Two-way ANOVA. (K and L) Glucose or KCl stimulates insulin secretion from duodenum of control or DBZ and Repsox combination–treated NFKO mice. n = 12–25. Data are represented as mean ± SEM. Mann-Whitney rank-sum test.

