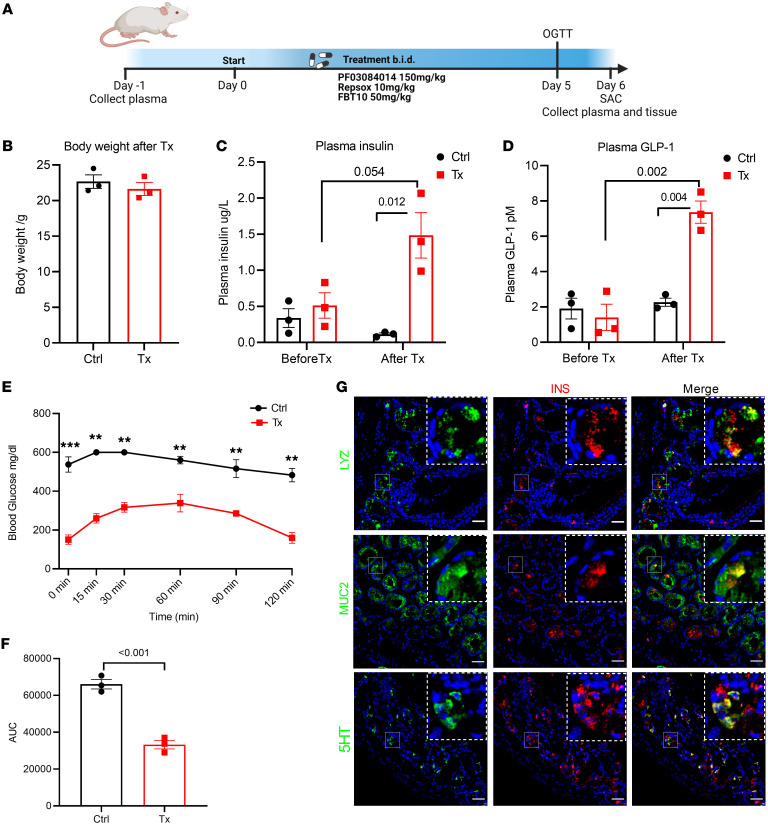
Figure 6. Triple combination therapy lowers blood glucose and induces gut β-like cells in NOD mice.
(A) Experimental design for PF-03084014, Repsox, and FBT10 triple combination treatment of NOD mice.(A) Body weight measurement after 5 days of combination treatment in control (vehicle) and Tx (treatment) groups. n = 3 mice each group. Data are represented as mean ± SEM. Two-tailed t test. (C and D) Plasma insulin and GLP-1 in control and treatment groups before and after 5-day treatment. (E) OGTTs after 5 days of vehicle or triple combination treatment. (F) AUC of OGTT shown in E. (G) Representative IHC of lysozyme (upper panels, green), MUC2 (middle panels, green), and 5HT (lower panels, green) costained with insulin (red) in triple combination therapy–treated NOD mice; green and red channel colocalization shown in yellow. Scale bars: 40 μm. n = 3 mice each group. Data are represented as mean ± SEM. Two-tailed t test.

