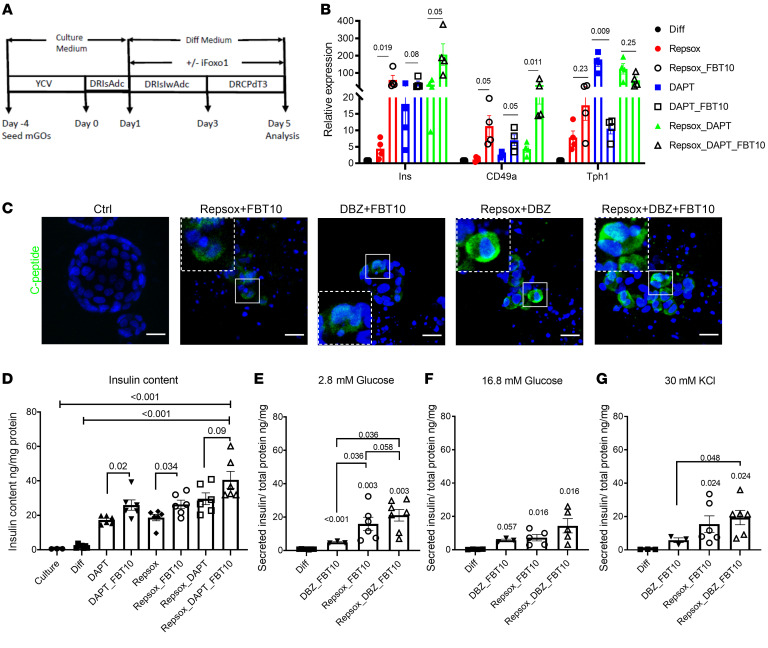
Figure 7. Induction of β-like cells by combination treatment in hGOs.
(A) Schematic showing treatment protocol. (B) QPCR of different marker genes from hGOs treated with the differentiation cocktail. Data are represented as mean ± SEM. Paired t test. (C) Representative IHC images of C-peptide (green) staining in hGOs treated with differentiation cocktail. Scale bars: 20 μm. (D) Insulin content of the differentiation cocktail–treated hGOs. n = 6 independent experiments. Data are represented as mean ± SEM. One-way ANOVA. (E–G) Glucose and KCl stimulate insulin secretion from hGOs treated with different cocktails. n = 3 independent experiments, 1–3 replicates in each experiment. Data are represented as mean ± SEM. Two-tailed t test.

