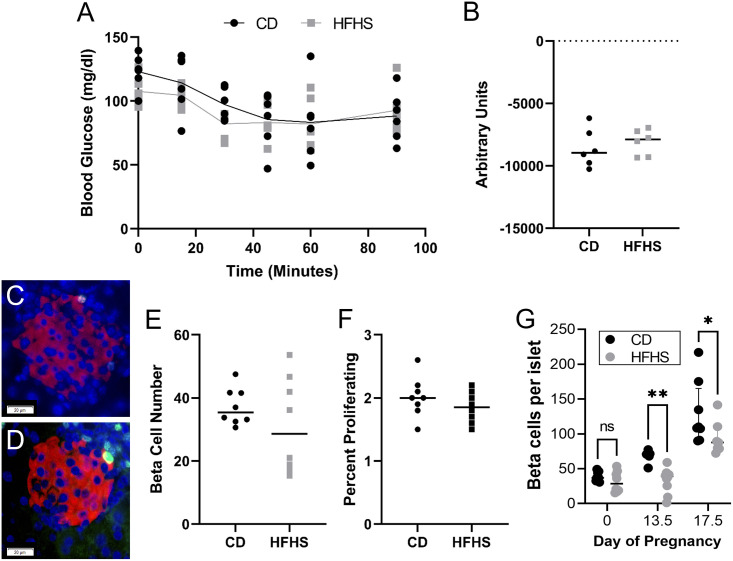
Fig 2. Insulin tolerance and beta cell numbers are normal at mating.
Insulin tolerance curve (A) and inverse AUC (B) are not different between CD and HFHS fed mice on day 0 of pregnancy. Pancreatic islets were immuno-stained for insulin (red), Ki67 (green) and nuclei (dapi, blue). Representative images were chosen based on average islet cell numbers in (C) CD and (D) HFHS fed mice. Images were analyzed to determine mean number of (E) beta cells and (F) proliferating beta cells. For all ipITT measurements n = 6 CD and 6 HFHS, for day 0 histology n = 8 CD and 8 HFHS. (G) Combined beta cell number data from day 0 presented in this manuscript and day 13.5 and 17.5 data presented in our previous report [21]. Lines represent median values.

