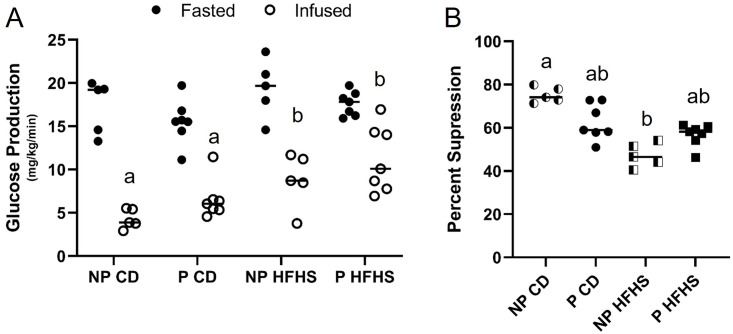
Fig 5. Glucose production is suppressed by HFHS diet.
Glucose production was obtained during the fasted and infused state and then percent glucose suppression was calculated. (A) Glucose production in the basal and clamped state. (B) Percent suppression of glucose production from basal to clamped state. N = 5 NP CD, 7 P CD, 5 NP HFHS and 7 P HFHS mice. Lines represent median values. * represents p<0.01. Different letters indicate significant difference among groups (p<0.01).

