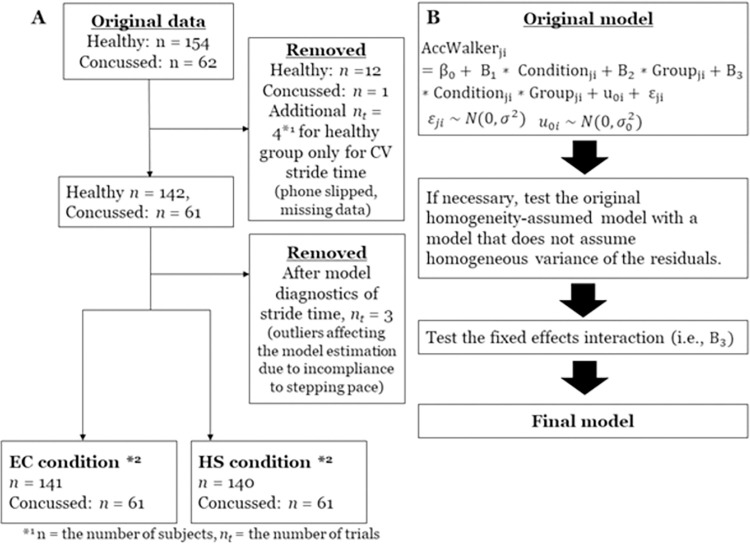
Fig 2. Data processing and model specification flow chart.
Abbreviations: HS = head shake, EC = Eyes-closed conditions. (A) Flow chart of the data processing. The two boxes in the bottom are the sample size submitted for the statistical analyses for all variables except CV Stride time. *1 n = the number of subjects, nt = the number of trials. *2 for CV stride time, n = 138 healthy and n = 61 concussed participants for the EC condition and n = 141 healthy and n = 60 concussed participants for the HS condition were submitted for analyses. (B) the model specification process: Fixed effects coefficients are B0, B1, B2, and B3, j = j-th group of i-th individual. u0i represents the random effect of the individual intercept, and e0i represents the residuals, where both are assumed to be normally distributed.

