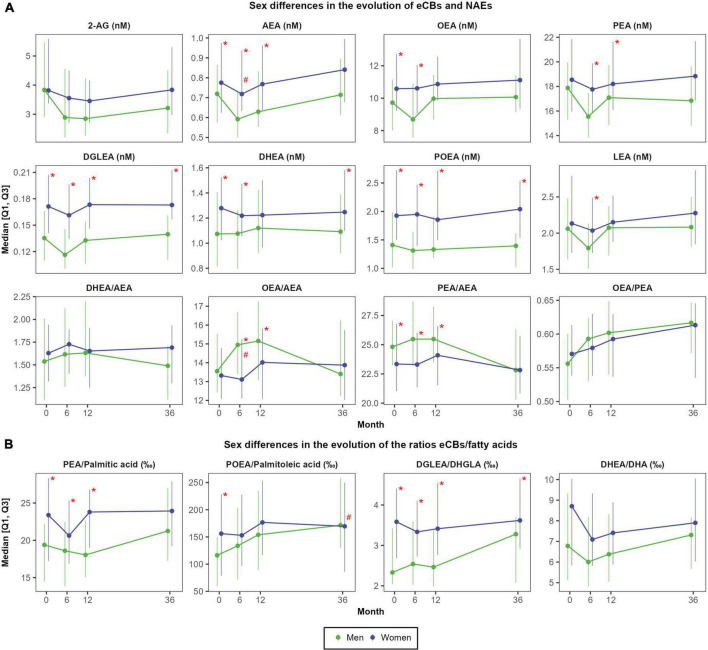
FIGURE 4.
Sex differences in the evolution of eCBs concentrations (A) and in the evolution of the ratios between eCBs and their precursor fatty acids (B). N = 48 men and N = 57 women. Red asterisks (*) indicate significant sex differences at each time point (P < 0.05). Red hashes (#) indicate significant sex differences in the rate of change from baseline (P < 0.05). Dependent variables were normalized before estimating linear or linear mixed effects models (when deemed appropriated) using ordered quantile normalization (ORQ) transformation. Models were adjusted by sex, age, intervention group, and diagnostic of diabetes. Q1, first quartile; Q3, third quartile; 2-AG, 2-arachidonoylglycerol; AEA, anandamide or N-arachidonoyl-ethanolamine; DHEA, N-docosahexaenoylethanolamine; DGLEA, N-dihomo-γ-linolenoyl ethanolamide; DHA, docosahexaenoic acid; DHGLA, dihomo-gamma-linolenic acid; eCBs, endocannabinoids; LEA, N-linoleoylethanolamine; NAEs, N-acylethanolamines; OEA, oleoylethanolamide; PEA, palmitoylethanolamide; POEA, N-palmitoleoylethanolamine.

