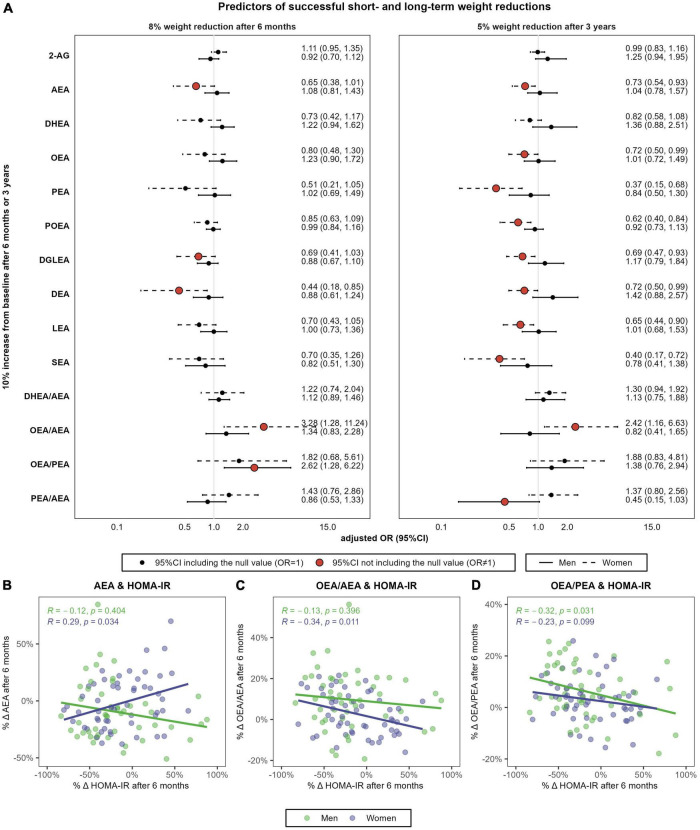
FIGURE 6.
Sex-specific association between relative changes in eCBs, NAEs and their ratios, and the achievement of 8% weight reductions after 6 months or 5% weight reductions after 3 years (A) and correlation between 6-months percentual changes in HOMA-IR and the respective change in AEA (B), OEA/AEA (C) and OEA/PEA (D). N = 48 men and N = 57 women. (A) Shows multivariable-adjusted odds ratio (OR) and 95% confidence intervals (95%CI). Logistic regression models were stratified by sex and adjusted by baseline body weight, intervention group, age, and diagnostic of diabetes. (C,D) Shows the Spearman’s rank correlations coefficient and P-values. HOMA-IR, Homeostasis Model Assessment of Insulin Resistance; 2-AG, 2-arachidonoylglycerol; AEA, anandamide or N-arachidonoyl-ethanolamine; DHEA, N-docosahexaenoylethanolamine; DGLEA, N-dihomo-γ-linolenoyl ethanolamide; LEA, N-linoleoylethanolamine; OEA, oleoylethanolamide; PEA, palmitoylethanolamide; POEA, N-palmitoleoylethanolamine.

