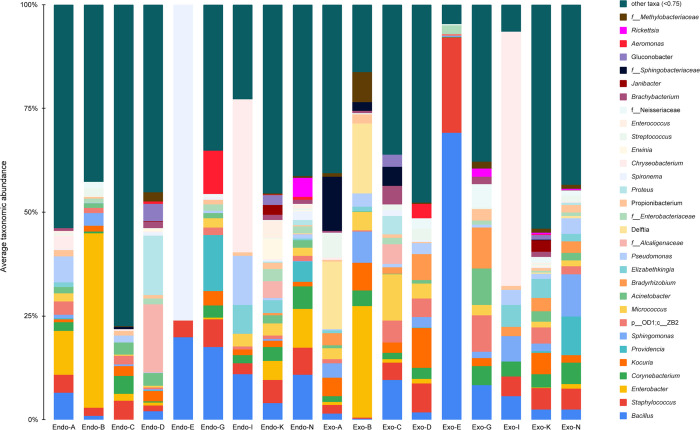
Fig 6. Relative abundances of major bacterial taxa at the genus level.
‘Other’ group represents all taxa with relative abundance below 0.75%. Each bar plot represents the mean sample composition for each home. Endo represents internal body samples, while Exo represents external body samples. Some taxa were not found at the genus level. “f_” represents family; “p_” represents phylum, and “c_” represents class.

