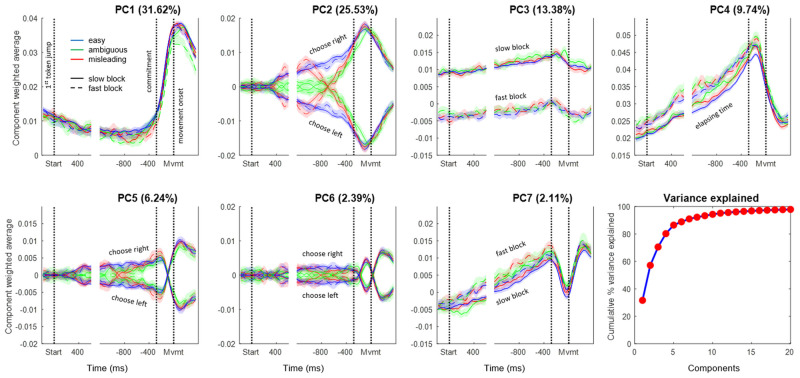
Fig 2. Components produced by PCA.
The cumulative variance explained by the first 20 components is shown at the bottom right, and the temporal profiles of the top 7 PCs are shown in the rest of the figure. Each of those 7 panels shows the average activity of all cells, weighted by their loading coefficient onto the given PC, for 12 trial groups, including combinations of 3 trial types: easy (blue), ambiguous (green), and misleading (red); two blocks: Slow (solid) and Fast (dashed); for choices made to the left or right (indicated for the components where they differ). Note that the sign is arbitrary because the loading matrix can have positive or negative values. Shaded regions indicate 95% confidence intervals computed using bootstrapping. In each panel, data are shown aligned to the start of token jumps as well as to movement onset. Commitment time is estimated to be 280 ms before movement onset, based on our prior studies [36, 44]. Each panel is scaled to have the same range in the y-axis. PCs are built from the 402 cells that have trials in all conditions. Data and code available at https://doi.org/10.6084/m9.figshare.20805586.

