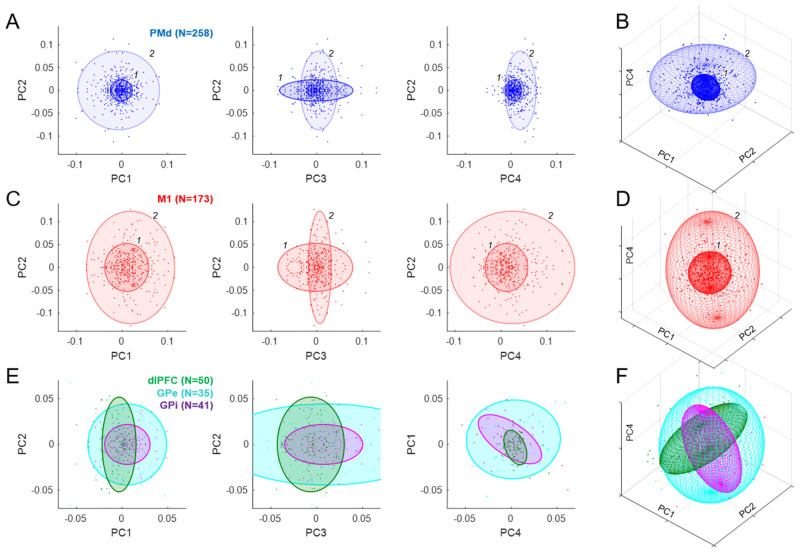
Fig 8. Analysis of loading coefficients (all cells).
(A) Each point indicates the weight of the contribution of a given PMd cell to the principal component indicated on the axes. Colored ellipses indicate the centroid and 3 times standard deviation of each of the two gaussians (labeled 1 and 2) that provided the best fit to the distribution of these populations. (B) The same PMd gaussians in the 3D space of PC1, PC2, and PC4. (C) Same as A for M1. (D) Same as B for M1. (E) Same as A for cell populations in dlPFC (green), GPe (cyan), and GPi (purple), each of which was best fit with a single gaussian. Note that unlike A and C, here the right panel shows PC4 vs. PC1. (F) Same as B for dlPFC, GPe, and GPi. Data and code available at https://doi.org/10.6084/m9.figshare.20805586. dlPFC, dorsolateral prefrontal cortex; GPe, globus pallidus externus; GPi, globus pallidus internus; M1, primary motor cortex; PC, principal component; PMd, dorsal premotor cortex.

