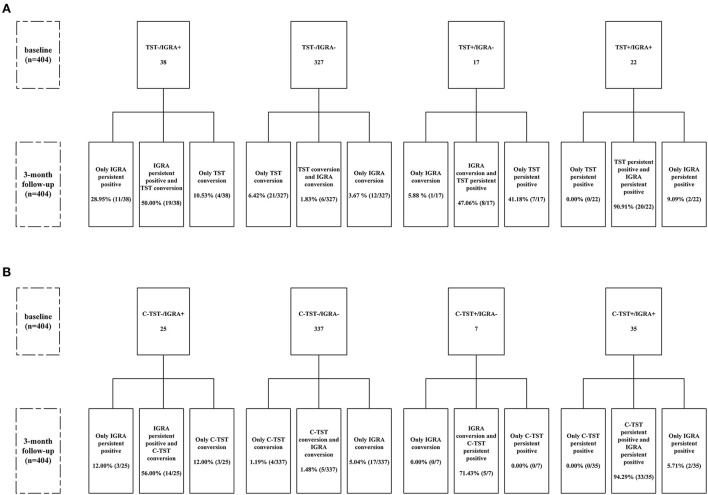
Figure 1.
Flow chart of serial testing of TST and C-TST according to IGRA results. (A) Stratified analysis according to baseline results of IGRA and TST (using cutoff value of 10 mm); (B) Stratified analysis according to baseline results of IGRA and C-TST. C-TST, Creation tuberculin skin test; IGRA, Interferon-gamma release assay; TST, Tuberculin skin test. TST conversion was defined as the average diameter of induration ≥ 10 mm for those with baseline survey < 5 mm, or increased ≥ 10 mm when the baseline survey result was between 5 and 10 mm. C-TST conversion was defined as the average diameter of induration and erythema increased from < 5mm at baseline survey to induration or erythema ≥ 5mm at follow-up survey. IGRA conversion was defined as the IFN-γ releasing level of TB antigen-Nil (TBAg-Nil) increased from < 0.35 IU/ml at baseline survey to ≥ 0.35 IU/ml at follow-up survey. Persistent positive was defined as both positive for baseline and follow-up surveys according to the baseline positivity cutoff value.

