
Figure 2. Conservation of synteny between the genomes of C. graminicola and C. higginsianum.
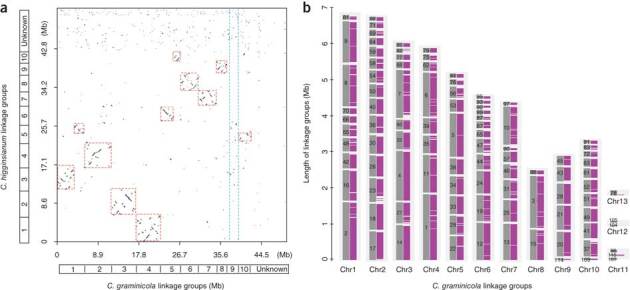
(a) Dot plot showing the syntenic blocks between the 13 chromosomes (optical linkage groups) of C. graminicola (horizontal axis) and the 12 chromosomes of C. higginsianum (vertical axis). Homologies between chromosomes of each species are highlighted in red dashed boxes. Homologous sequences of C. graminicola chromosome 9, indicated between the blue dashed lines, are dispersed among many C. higginsianum chromosomes. (b) Global view of syntenic alignments between the genomes of C. graminicola and C. higginsianum. Linkage groups of C. graminicola are shown as the reference, with linkage group lengths defined by the C. graminicola optical map. For each chromosome, numbered genomic scaffolds (dark gray) positioned on the optical linkage groups are separated by scaffold breaks. The magenta blocks show syntenic mapping of the C. higginsianum sequences; notably, there is a near absence of homologous sequences among the minichromosomes.