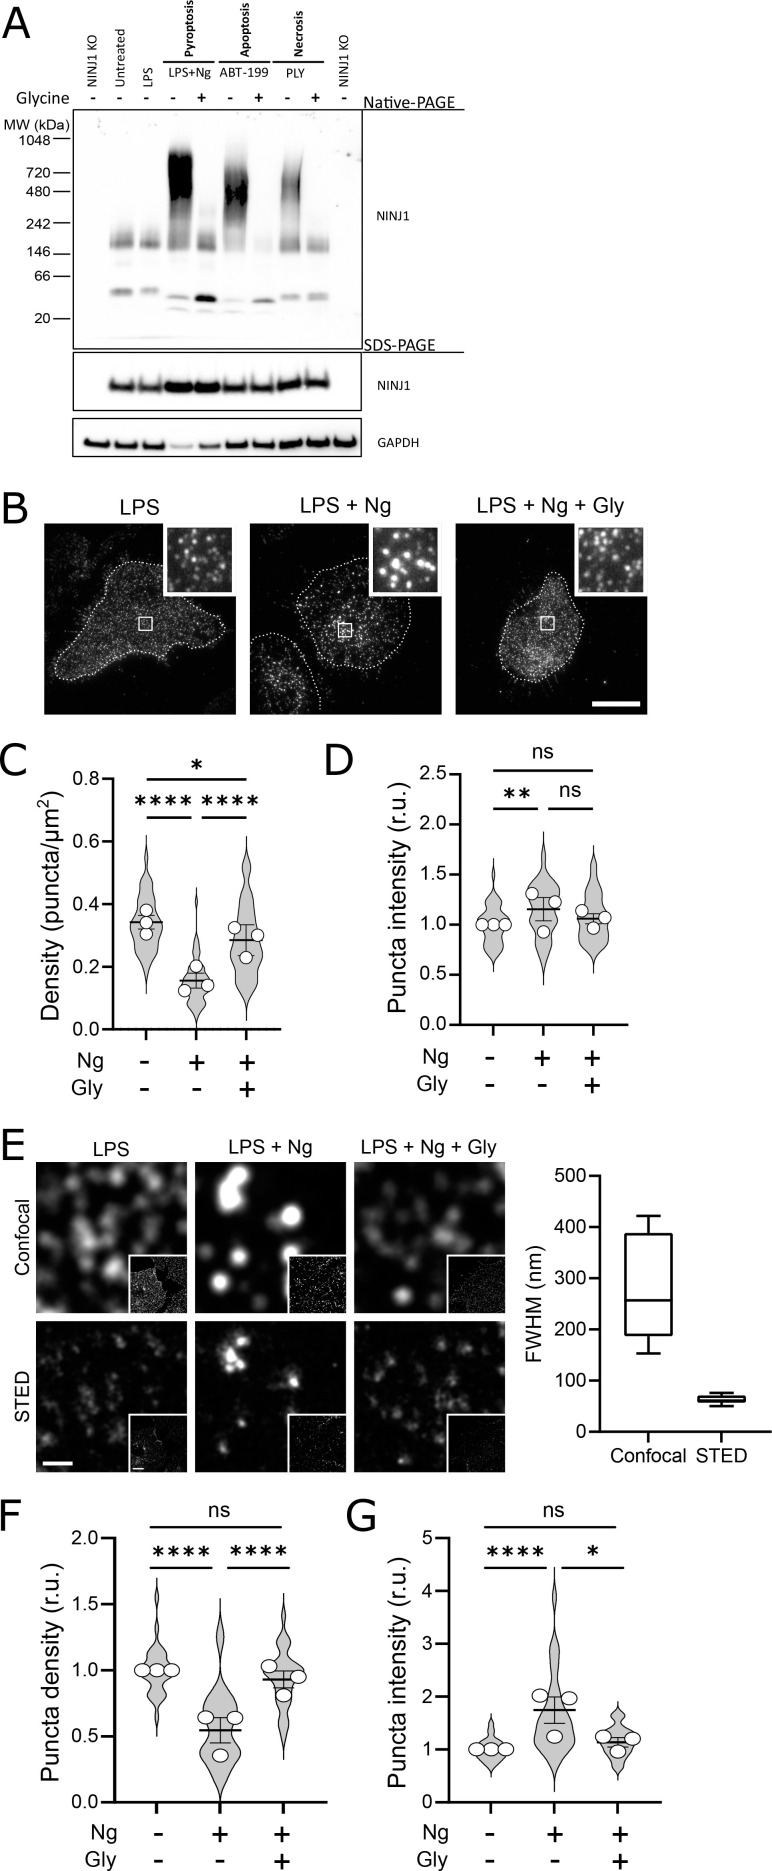
Figure 3. Glycine targets NINJ1 oligomerization to prevent membrane rupture in primary mouse macrophages.
(A) Primary bone marrow-derived macrophage (BMDM) was induced to undergo pyroptosis (nigericin), apoptosis (venetoclax, ABT-199), or necrosis (pneumolysin) with or without glycine treatment. Native-PAGE analysis of endogenous NINJ1 demonstrates a shift to high molecular weight aggregate upon cell death stimulation, which is abrogated by glycine treatment. (B) Total internal reflection microscopy of NINJ1 in LPS-primed primary BMDM reveals that endogenous NINJ1 resides in discrete puncta within the plasma membrane. Cell membrane outline (dotted white line) was determined using fluorescently labeled cholera toxin subunit B (not shown) as a plasma membrane marker. Scale bar 20 µm. Inset shows magnified area demarcated by the white box. Anti-mouse NINJ1 antibody validation for immunofluorescence is provided in Figure 3—figure supplement 1. Quantification of the density (C) and mean fluorescence intensity (D) of NINJ1 puncta in LPS-primed primary macrophages at baseline or stimulated to undergo pyroptosis (nigericin 20 µM for 30 min) without or with glycine (5 mM). NINJ1 puncta become less dense and brighter upon pyroptosis induction, consistent with NINJ1 plasma membrane clustering. Glycine limits this redistribution. Violin plot of NINJ1 puncta density from three pooled independent experiments. Data points superimposed on the violin plots are the mean NINJ1 puncta densities for the three independent experiments (10–23 cells measured per replicate with >675 NINJ1 puncta identified per replicate). Bars represent mean ± SEM of the NINJ1 densities for the n=3 independent experiments. * p<0.05, ** p<0.01, and **** p<0.0001 by Kruskal–Wallis test with Dunn’s multiple comparison correction. (E) Representative confocal (top) and stimulated emission depletion (STED; bottom) images of LPS-primed primary mouse bone marrow-derived macrophage (BMDM) at baseline or stimulated to undergo pyroptosis (nigericin 20 µM for 30 min) without or with glycine (5 mM). Full-width at half maximum of identified NINJ1 puncta shows a resolution of 271±98 nm and 63±8 nm (mean ± SD) for standard confocal and STED microscopy, respectively. Scale bar 0.5 µm; inset scale bar 20 µm. (F–G) Quantification of the normalized NINJ1 puncta density (F) and mean fluorescence intensity (G) from the STED images. The NINJ1 puncta become less dense with a corresponding increase in fluorescence intensity upon pyroptosis induction, consistent with NINJ1 plasma membrane clustering. Glycine limits these effects. Violin plot of the individual NINJ1 puncta from three pooled independent experiments (8–14 cells per replicate with >4964 NINJ1 puncta identified per replicate). Bars represent mean ± SEM of the NINJ1 densities for the n=3 independent experiments. * p<0.05 and **** p<0.0001 by Kruskal–Wallis test with Dunn’s multiple comparison correction.


