
Figure 1. Thymic macrophages (ThyMacs) can be identified by the expression of CD64, MerTK, and F4/80.
(A) Flow cytometric analysis of enzymatically digested thymus tissue with macrophage markers CD64, MerTK, F4/80, and CD11b. (B) Gating strategy for identifying ThyMacs: CD64+FSChi are first gated; the F4/80+CD11blo cells among them are the ThyMacs, while F4/80loCD11b+ are the thymic monocytes (ThyMonos). (C) Pappenheim (Hemacolor Rapid staining kit) staining of sorted ThyMacs. (D) Lack of expression of lineage markers associated with other cell types on ThyMacs. (E) The expression on ThyMacs of three receptors for phosphatidylserine that participates in the phagocytosis of apoptotic cells. (F) Labeling of ThyMacs with intravenously injected anti-CD45-PE antibody or PBS. The labeling of blood leukocytes is shown for comparison. (G) Average numbers and percentages of ThyMacs in 4–11 weeks old mice, n=82. (H) Comparison of the numbers and percentages of ThyMacs in mice of different ages, n=82. All flow cytometry plots are representative of at least three independent repeats. The numbers in the flow cytometry plots are the percent of cells in the respective gates. Data in (G) and (H) represent mean ± SEM. Statistical significance in (H) was determined with one-way ANOVA.

Figure 1—figure supplement 1. Representative flow cytometry staining of enzymatically digested thymus single-cell suspension for CD64, MerTK, and F4/80 and respective isotype controls.

Figure 1—figure supplement 2. Immunofluorescent images of thymic sections showing co-localization of MerTK and CD64 staining (upper row) and TIM4 and CD64 staining (lower row) in the thymic cortex.

Figure 1—figure supplement 3. Expression of CD11c, MHC2, and SIRPα on thymic macrophages with respective controls.
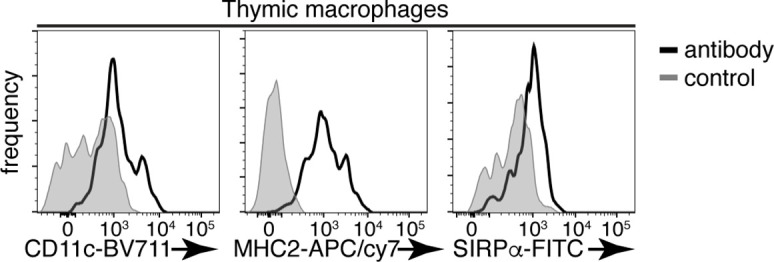
Figure 1—figure supplement 4. Example flow cytometry plots showing that gating on CD11c+MHC2+ thymus cells, in addition to dendritic cells (DCs), also includes macrophages, especially among SIRPα+ cells.
