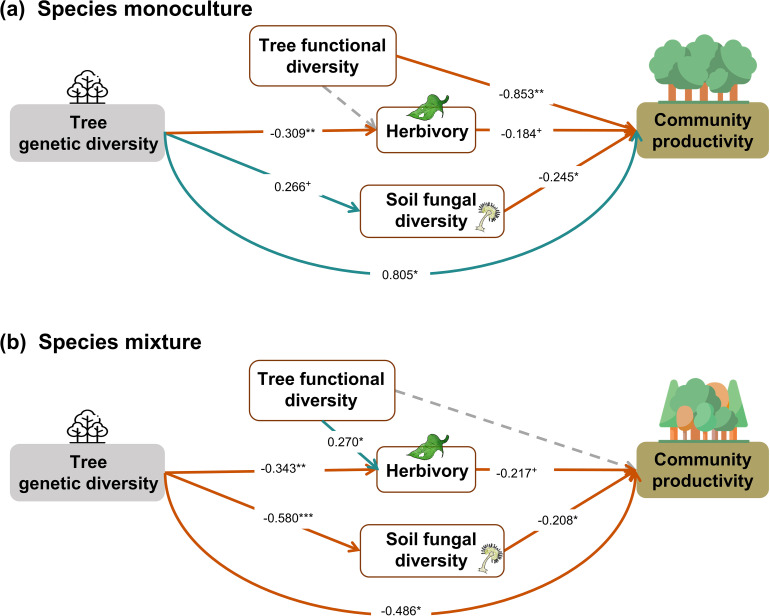
Appendix 3—figure 2. Effects of tree genetic diversity on higher trophic levels and tree community productivity in tree species monocultures (a) and mixtures of four tree species (b) without the paths between genetic diversity and functional diversity.
The results were obtained by a multigroup structural equation model (SEM) (global Fisher’s C = 3.485, DF = 4, p = 0.480). Positive and negative paths are indicated in green and orange, respectively. The standardized path coefficients are indicated by the numbers, and statistical significance is indicated by asterisks (*** p < 0.0001, ** p < 0.001, * p < 0.05, and + p <0.1). Gray dashed lines indicate nonsignificant (p > 0.1) pathways in the final model. Here, tree functional diversity was calculated from traits measured on individual trees. To allow comparison, the same SEM as for Figure 5 was used. Multigroup SEM analyses first test the interaction (explanatory variable × groups) in the whole model using the full dataset and then estimate the local coefficient for each path by using different datasets (the full dataset or group sub-datasets [species richness = 1 or 4, respectively]) depending on the significance of explanatory variable × groups interactions. Thus, we could not get the percentage of the explained variance in the local multigroup SEM model.

