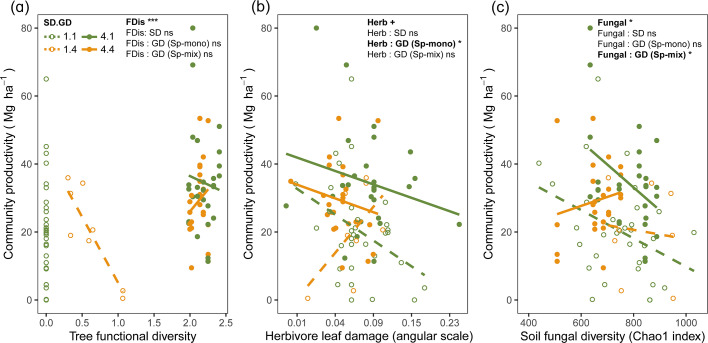
Figure 3. Bivariate relationships between tree community productivity and tree functional diversity (a), herbivory (b), and soil fungal diversity (c).
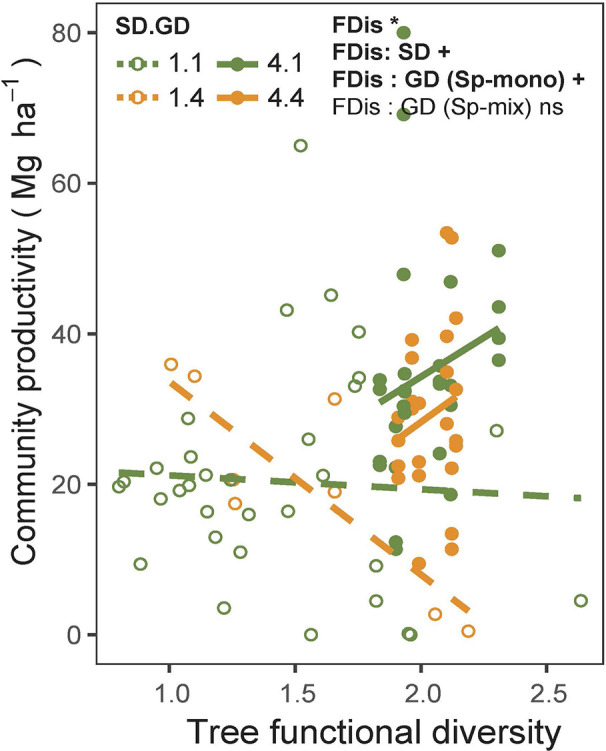
Green unfilled/dashed symbols represent genetic monocultures in species monocultures, green filled/solid symbols represent genetic monocultures in species mixture, orange unfilled/dashed symbols represent genetic mixtures in species monocultures, orange filled/solid symbols represent genetic mixture in species mixture. FDis, tree functional diversity; Herb, herbivore damage; Fungal, soil fungal diversity; Sp-mono, species monocultures; Sp-mix, species mixtures; SD, species diversity; GD, genetic diversity. ‘:’ indicates the interaction effects. Asterisks indicate statistical significance (*** p < 0.0001, ** p < 0.001, * p < 0.05, + p < 0.1, and ns p > 0.1).
Figure 3—figure supplement 1. Effects of tree functional diversity calculated from traits measured on individual trees on community productivity.


