. 2022 Nov 29;11:e78703. doi: 10.7554/eLife.78703

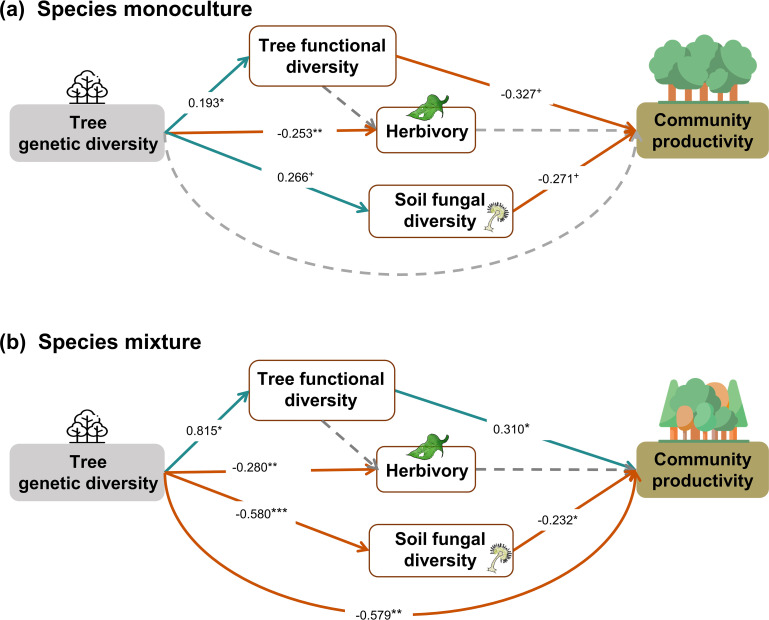
Figure 5. Effects of tree genetic diversity on higher trophic levels and tree community productivity in tree species monocultures (a) and the mixture of the four tree species (b).

The results were obtained by a multigroup structural equation models (SEM) (global Fisher’s C = 3.416, DF = 4, p = 0.491). Positive and negative paths are indicated in green and orange, respectively. The standardized path coefficients are indicated by the numbers, and statistical significance is indicated by asterisks (*** p < 0.0001, ** p < 0.001, * p < 0.05, and + p < 0.1). Gray dashed lines indicate nonsignificant (p > 0.1) pathways in the final model. The nonsignificant path from tree functional diversity to soil fungal diversity was removed because the removal decreased the AICc by more than 2 (ΔAICc = 2.176). Multigroup SEM analyses first test the interaction (explanatory variable × groups) in the whole model using the full dataset and then estimate the local coefficient for each path by using different datasets (the full dataset or group sub-datasets [species richness = 1 or 4, respectively]) depending on the significance of explanatory variable × groups interactions. Thus, we could not get the percentage of the explained variance in the local multi-group SEM model. All the paths were allowed to be different between species monocultures and mixtures (none of the paths was constrained manually beforehand); the interaction statistics of the multigroup model, and the explained variance of the whole model for each response is shown in Appendix 2—table 5.

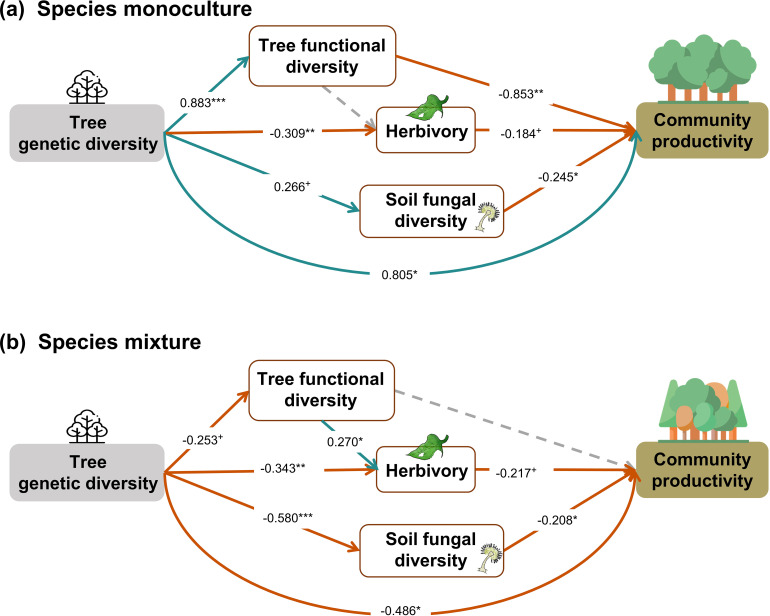
Figure 5.

Figure 5—figure supplement 1. Effects of tree genetic diversity on higher trophic levels and tree community productivity in tree species monocultures (a) and mixtures of four tree species (b) with functional diversity calculated using trait values of individual trees.

Figure 5—figure supplement 1.

The results were obtained by a multigroup structural equation models (SEM) (global Fisher’s C = 2.747, DF = 4, p = 0.601). Positive and negative paths are indicated in green and orange. The standardized path coefficients are indicated by the numbers, and statistical significance is indicated by asterisks (*** p < 0.0001, ** p < 0.001, * p < 0.05, and + p < 0.1). Gray dashed lines indicate nonsignificant (p > 0.1) pathways in the final model. Here, tree functional diversity was calculated from traits measured on individual trees. To allow comparison, the same SEM as for Figure 5 was used. Multigroup SEM analyses first test the interaction (explanatory variable × groups) in the whole model using the full dataset and then estimate the local coefficient for each path by using different datasets (the full dataset or group sub-datasets [species richness = 1 or 4, respectively]) depending on the significance of explanatory variable × groups interactions. Thus, we could not get the percentage of the explained variance in the local multigroup SEM model.
Figure 5—figure supplement 2. Initial structural equation models (SEM) structure of genetic diversity effects in both species monocultures and mixtures.

Figure 5—figure supplement 2.

Genetic diversity represents the number of seed families per tree species. Functional diversity (based on FDis) represents the mean distance of seed-family means to the centroid of all seed families. Herbivory represents the percentage of herbivore leaf damage, soil fungal diversity was quantified by Chao1 diversity index, community productivity represents tree productivity of subplots (Mg ha–1).