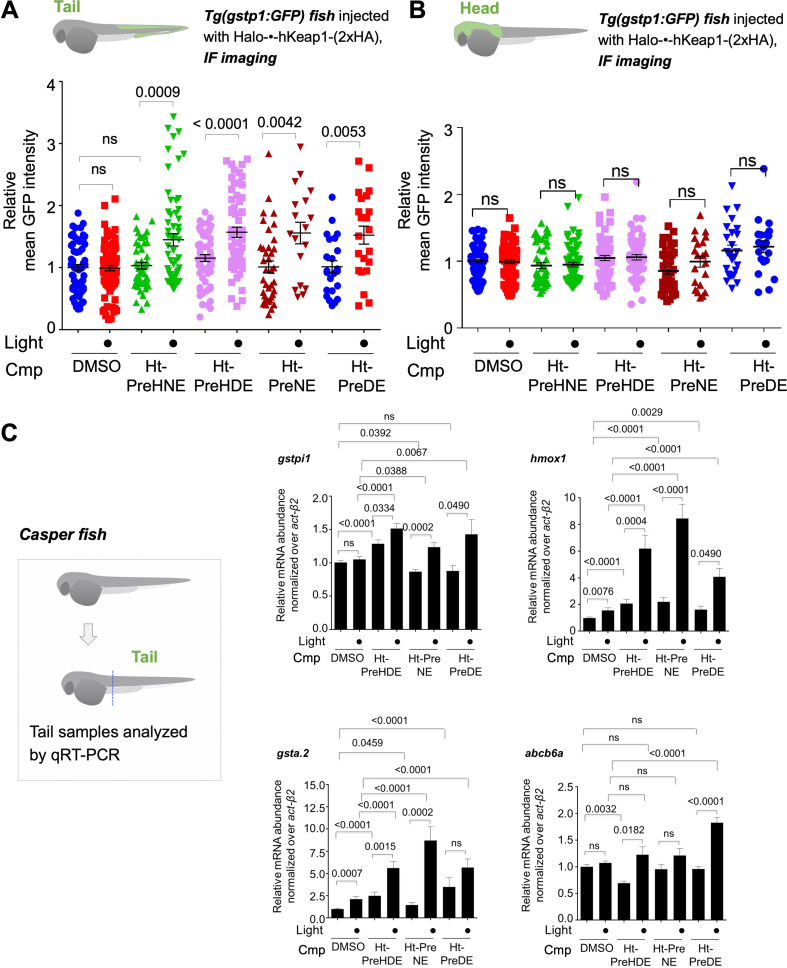
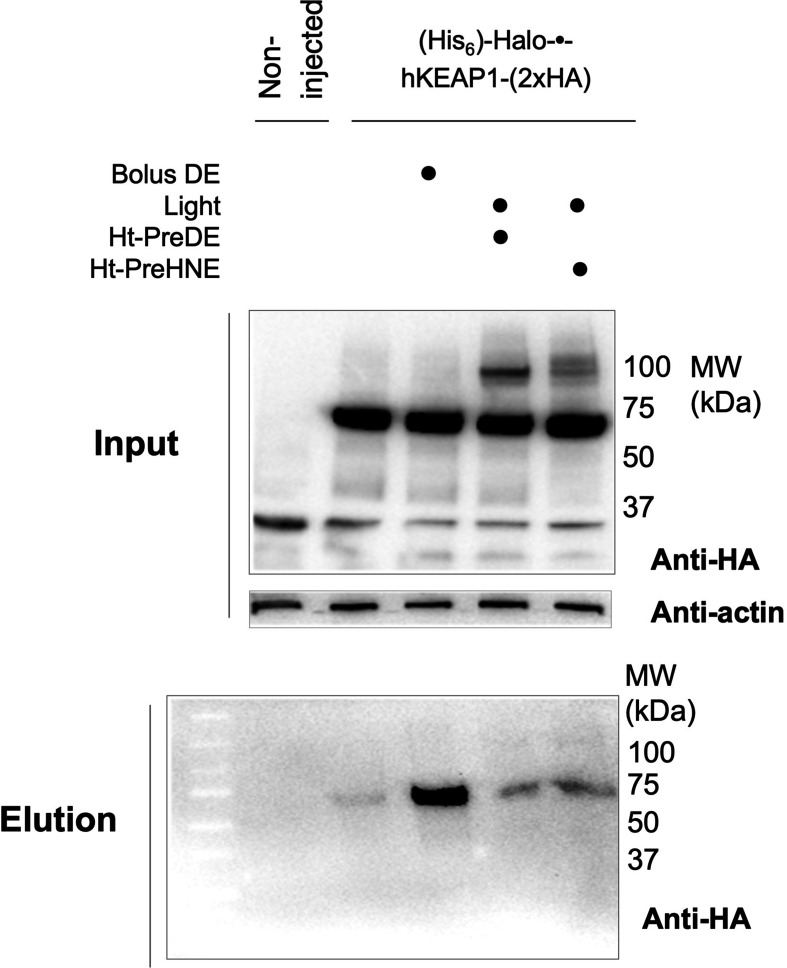
Figure 4. Z-REX delivery of 4-different electrophiles studied consistently labels hKeap1 and activates AR to similar extent (as previously observed in cell culture).
Also see Figures 5–6 and Figure 3—figure supplement 1, Figure 3—figure supplements 3–5, Figure 4—figure supplement 1, Figure 5—figure supplement 1. (A) Quantitation of mean AR-levels in the tail of embryos 4 h post Z-REX with indicated LDEs. Image quantitation was performed on the tail-regions as illustrated. No. embryos analyzed: DMSO: No light (65), with light (84); Ht-PreHNE: No light (47), with light (59); Ht-PreHDE: No light (59), with light (59); Ht-PreNE: No light (38), with light (18); Ht-PreDE: No light (23), with light (22). (B) Similar quantitation in the head shows no increase in AR post Z-REX. Image quantitation was performed on the head-regions as illustrated. No. embryos analyzed: DMSO: No light (65), with light (82); Ht-PreHNE: No light (49), with light (65); Ht-PreHDE: No light (63), with light (60); Ht-PreNE: No light (38), with light (21); Ht-PreDE: No light (23), with light (22). (C) hKeap1-modification alone is sufficient to drive endogenous AR-gene upregulation in the tail in casper zebrafish. Whole-head/-tail separation was performed as indicated in inset (left), prior to RNA isolation selectively from the tails. 2 h post Z-REX with indicated LDEs, embryos were euthanized, and RNA was isolated, and qRT-PCR analyses were performed on tail samples (see inset, left) targeting indicated downstream genes (see Appendix for primer sequences). n>4 independent biological replicates and 2 technical repeats for each sample. Inset: schematic for fish separation. Note: tail was taken as a representative segment in these experiments. All numerical data present mean ± sem. Numbers above the bars represent analysis by two-tailed t-tests.


