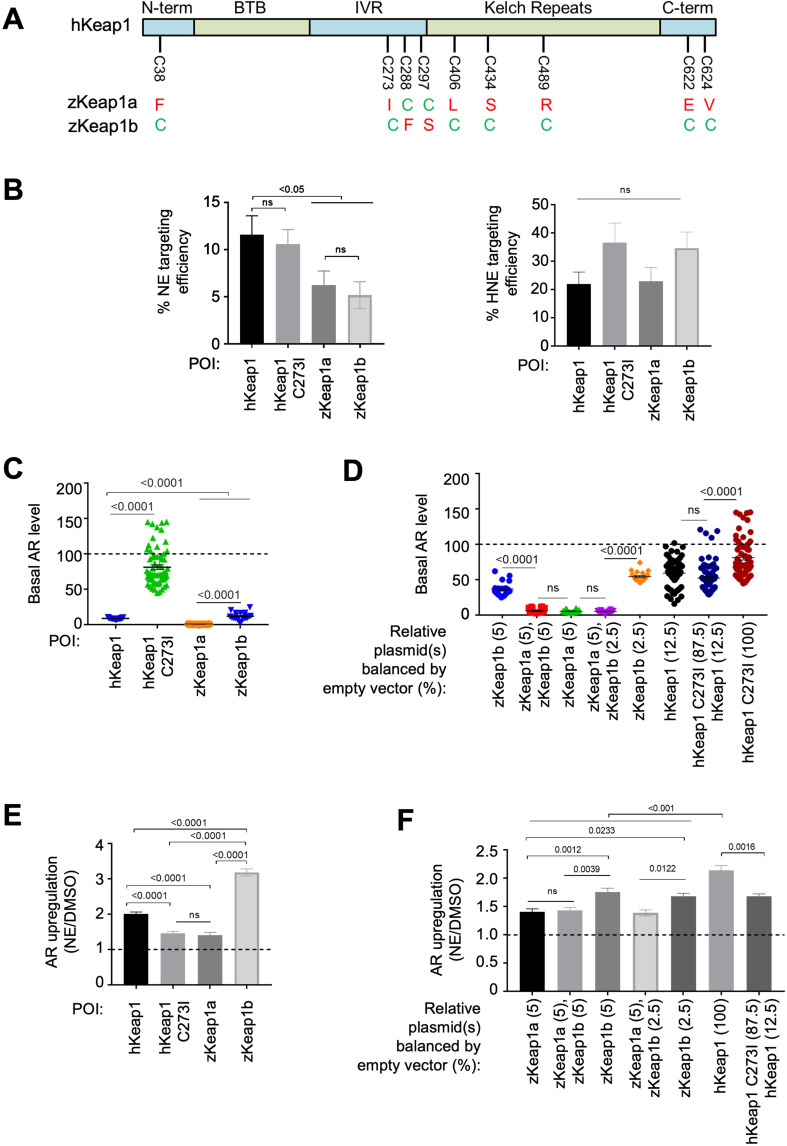
Figure 7. Cell-based studies of zKeap1a and zKeap1b recapitulate the dominant-negative behavior observed in developing embryos; cell-based T-REX analysis (Figure 1—figure supplement 1A) reveal similar electrophile sensitivity across all Keap1-variants.
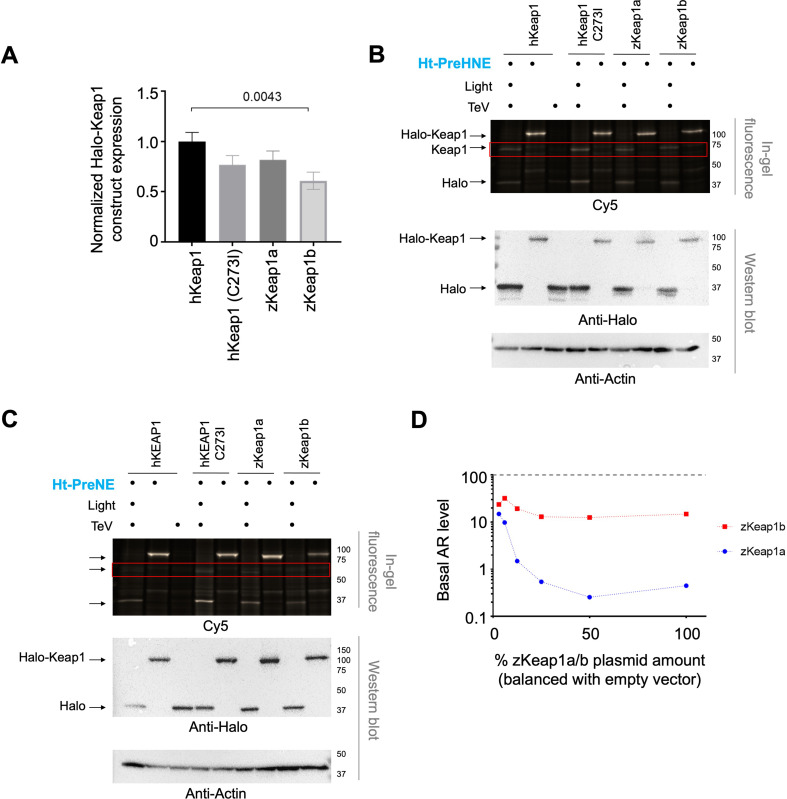
See also Figure 8A–B, Figure 7—figure supplements 1–2 and Figure 8—figure supplement 1. (A) The nine cysteines within hKeap1 that are present in only one of the two Keap1 paralogs in zebrafish. (N-term, BTB, IVR, Kelch-Repeats, C-term are individual conserved domains of Keap1). All indicated cysteines are conserved between human and zebrafish Keap1. (B) HEK293T cells were transiently transfected to express indicated Halo-•-Keap1 constructs. (See Figure 1—figure supplement 1D, Figure 7—figure supplement 2A and D for validation of construct functionality). 36 hr post transfection, cells were treated with Ht-PreNE (10 µM, 2 hr), and after rinsing cycles, cells were then exposed to UV light (5 mW/cm2 365 nm lamp). Post lysis, samples were treated with TeV protease and subjected to Click coupling with Cy5-azide. The targeting efficiency of NE on each variant was calculated using a previously-reported procedure Parvez et al., 2016; Van Hall-Beauvais et al., 2018. See Figure 7—figure supplement 2B-C for representative in-gel fluorescence and western blot data. (C) HEK293T cells were transfected with plasmids encoding ARE:Firefly luciferase and CMV:Renilla Firefly reporters, human myc-Nrf2, and Keap1 (Halo-•-hKeap1, Halo-•-(3xFLAG)-zKeap1a, Halo-•-(3xFLAG)-zKeap1b, Halo-•-hKeap1 C273I, or empty vector). (See Figure 1—figure supplement 1D, Figure 7—figure supplement 2A and D for validation of construct functionality). Basal (non-electrophile-stimulated) AR levels were quantified using a standard procedure Parvez et al., 2016; Long et al., 2017b; Van Hall-Beauvais et al., 2018. The horizontal dotted line represents basal AR levels with no exogenous Keap1 introduction. All conditions show a significant drop compared to basal level (i.e. with no exogenous Keap1 overexpression). No. independent biological replicates: Halo-•-hKeap1 (n=65), Halo-•-hKeap1 C273I (n=63), Halo-•-(3xFLAG)-zKeap1a (n=19), Halo-•-(3xFLAG)-zKeap1b (n=19). These were all dosed at a plasmid loading equivalent to 100%. Also see Figure 7—figure supplement 2A and D. (D) HEK293T cells were transfected with a mixture of plasmids encoding Halo-•-(3xF)-zKeap1a and Halo-•-(3xF)-zKeap1b in various ratios this mix also contained empty vector as required, myc-Nrf2, and AR reporter plasmids, see (C) See Figure 1—figure supplement 1D, Figure 7—figure supplement 2A and D for validation of construct functionality. 36 hr post transfection, AR was measured using a standard procedure Parvez et al., 2016; Long et al., 2017b; Van Hall-Beauvais et al., 2018. The horizontal dotted line indicates the basal AR levels in the absence of exogenously-introduced Keap1. Percentages are relative to those analyzed in Figure 7—figure supplement 2D. No. independent biological replicates: n=22 for zKeap1a/b mixing, n=63 for WT/C273I hKeap1 mixing. (E) A similar experiment to (C) except AR in response to NE bolus dosing was measured in HEK293T cells transfected with: Halo-•-hKeap1(WT); Halo-•-(3xFLAG)-zKeap1b; Halo-•-hKeap1(C273I); and Halo-•-(3xFLAG)-zKeap1a. (See Figure 1—figure supplement 1D, Figure 7—figure supplement 2A and D for validation of construct functionality). The horizontal dotted line represents the normalized AR-level for respective Keap1-variants following DMSO-treatment in place of NE. No. independent biological replicates: hKeap1 WT (n=28), hKeap1 C273I (n=28), zKeap1a (n=20), zKeap1b (n=20). (F) A similar experiment to (D), except AR in response to NE bolus dosing was measured in HEK293T cells. (See Figure 1—figure supplement 1D, Figure 7—figure supplement 2A and D for validation of construct functionality). Note: the indicated mix of Halo-•-(3xFLAG)-zKeap1a and Halo-•-(3xFLAG)-zKeap1b upregulated AR to a similar extent as Halo-•-(3xFLAG)-zKeap1a alone. The horizontal dotted line represents the normalized AR-level for respective Keap1-variants following DMSO-treatment in place of NE. Percentages are relative to those described in Figure 7—figure supplement 2D. No. independent biological replicates: n=54 for zKeap1a/b mixing, n=20 for WT/C273I hKeap1 mixing. All numerical data present mean ± sem. Numbers above the bars represent analysis by two-tailed t-tests.


