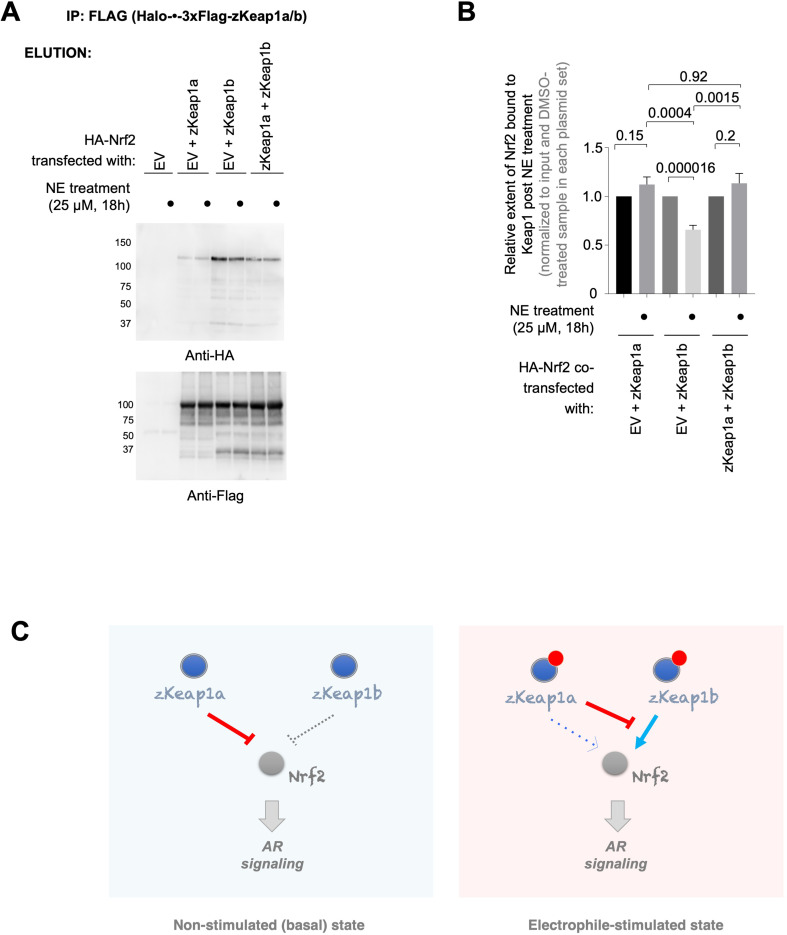
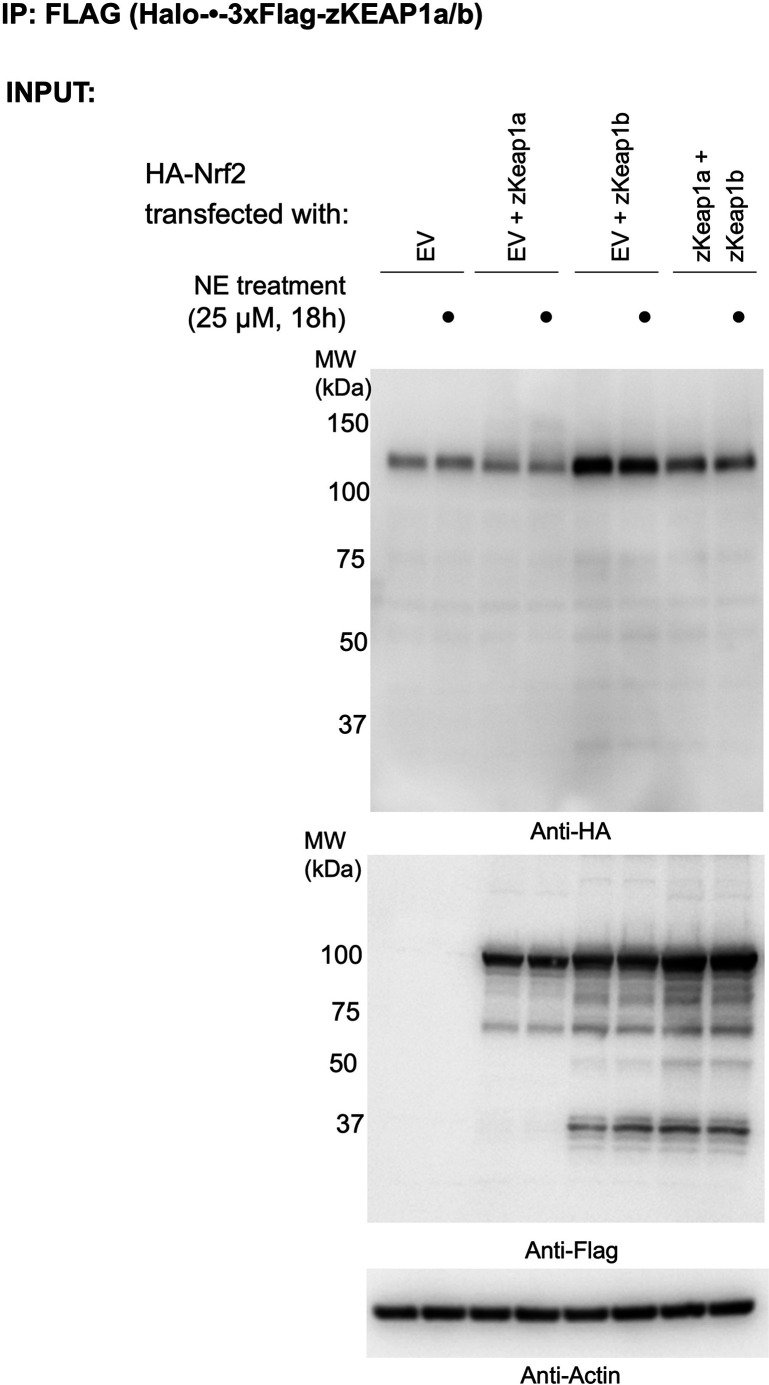
Figure 8. zKeap1a/b paralog-specific AR regulation is reflected by the differences in altered Nrf2 binding following electrophile stimulation.
(A) HEK293T cells were transfected with a plasmid encoding HA-Nrf2 [used because anti-HA-antibody is orthogonal to our anti-FLAG-antibody; and because this anti-HA-antibody (for detecting HA-Nrf2) is of higher sensitivity, compared to anti-myc-antibody to myc-Nrf2], and (an)other plasmid(s) encoding: either a mix of Halo-•–3xFlag-zKeap1a and Halo-•–3xFlag-zKeap1b, Halo-•–3xFlag-zKeap1a and empty vector (EV), Halo-•–3xFlag-zKeap1b and EV, or EV alone. The plasmid amount of HA-Nrf2 was 50% in all co-transfection conditions, and the rest of the co-transfected plasmids made up the other 50% (with equal 1:1 or 1:1:1 contribution from each plasmid, as applicable). Following whole-cell NE treatment (25 µM, 18 hr), normalized cell lysates were treated with anti-Flag M2 resin to evaluate the relative extent of association between zKeap1a/b and Nrf2 following NE stimulation. Representative blots for Elution. The band around ~37 kDa in anti-Flag blot, although of unknown identity, is present almost equally in both ‘zKeap1b’ and ‘zKeap1b+zkeap1 a’ samples, and thus its presence cannot be sufficient to explain the differences observed between these two data sets. See Figure 8—figure supplement 1 for the corresponding Input. (B) Quantification of (A) normalized over input (see Figure 8—figure supplement 1) and corresponding DMSO-treated samples in each set. Right panel: Quantification for Nrf2 association to zKeap1 upon NE bolus treatment for different ratios of zKeap1a:zKeap1b. (n=6 biological replicates). (C) Proposed model illustrating paralog-specific nuanced regulation of cellular antioxidant response (AR) under steady-state vs. electrophile-stimulated conditions. Left panel: under non-electrophile-stimulated conditions, zKeap1a is a more effective antagonist of Nrf2 (and hence, AR-signaling) than zKeap1b. Right: following electrophile stimulation, zKeap1b-modification results in a large upregulation in AR through significantly-reduced binding of Nrf2. By contrast, zKeap1a-modification gives rise to a weaker AR-upregulation, and zKeap1a—likely in the electrophile-modified or -non-modified state—functions as a negative regulator to suppress Nrf2/AR-pathway activation promoted by modified-zKeap1b. See also Figure 8A–B and Figure 8—figure supplement 1. All numerical data present mean ± sem. Numbers above the bars represent analysis by two-tailed t-tests.


