
Figure 1:
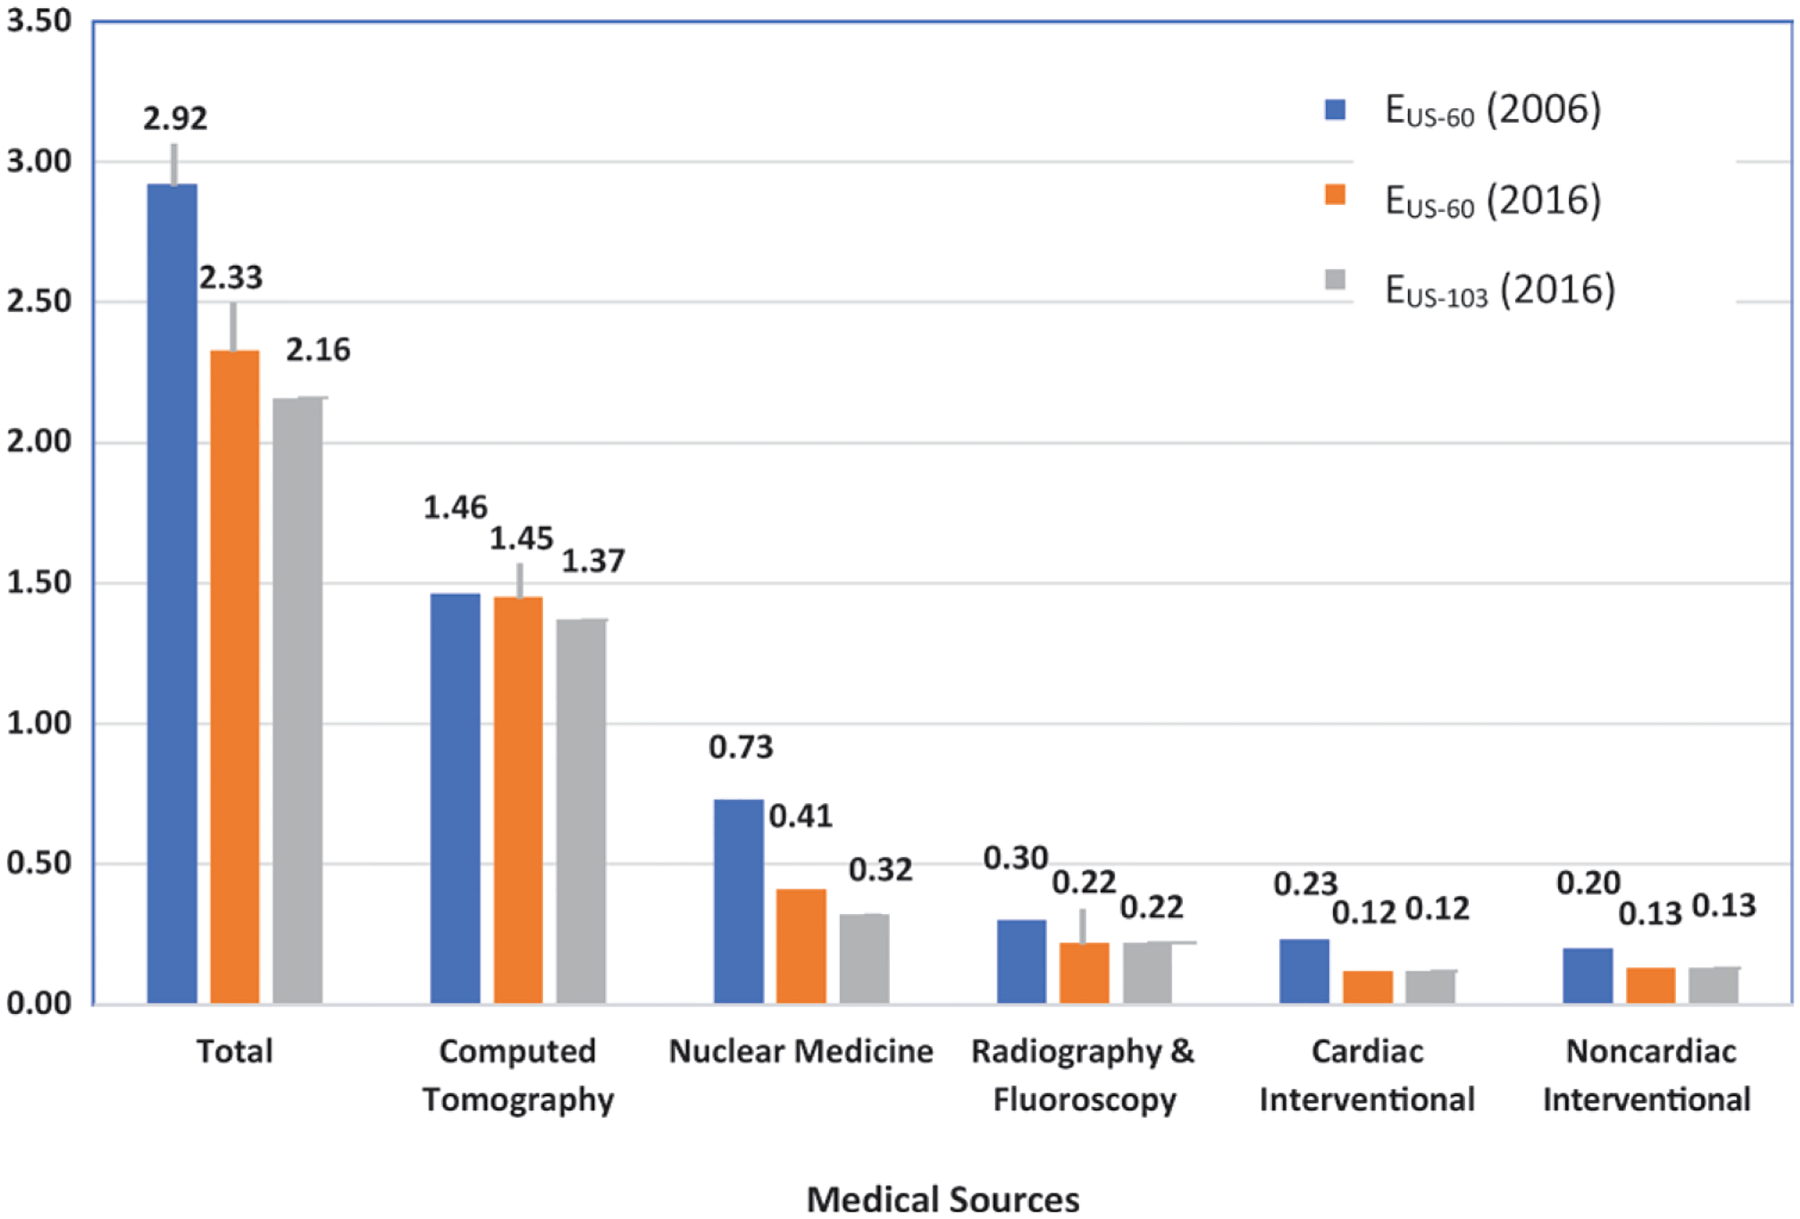
Bar graph shows estimated average annual individual effective dose in the United States from diagnostic and interventional patient radiation exposures (in millisieverts). Comparison between 2006 and 2016 has been computed by using weighting factors from International Commission on Radiological Protection (ICRP) Publications 60 and 103. EUS-60 = effective dose to a person in the United States using tissue-weighting factors from ICRP Publication 60 (8), EUS-103 = effective dose to a person in the United States using tissue-weighting factors from ICRP Publication 103 (9). Adapted with permission of the National Council on Radiation Protection and Measurements.