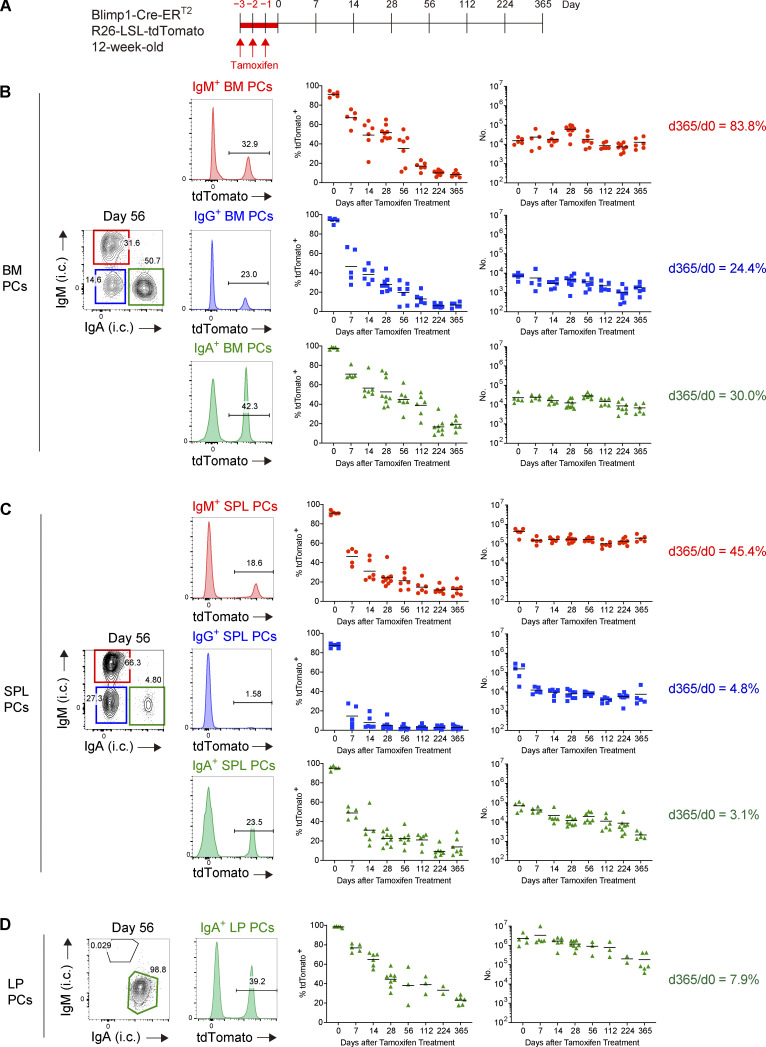
Figure 1.
Homeostatic PC turnover in BM, SPL, and LP. (A–D) Blimp1-Cre-ERT2 R26-LSL-tdTomato mice were treated with tamoxifen for 3 d. At the indicated time points after tamoxifen treatment, PCs in each organ were analyzed by FCM. The details of the mice and the experimental system are shown in Fig. S1. (A) Schematic of the experimental procedure. (B–D) Intracellular (i.c.) IgM or IgA expression (contour plots), tdTomato expression (histograms) by PCs of each isotype at day 56 after tamoxifen treatment (IgG+ PCs were defined as IgG+/IgM−/IgA−). The right two columns show the frequency and the absolute numbers of tdTomato+ cells for PCs of each isotype at the indicated time points in BM (B), SPL (C), and LP (D). Five to nine mice for PCs in BM or SPL or two to eight mice for PCs in LP were analyzed at each time point. Data collected from 14 independent experiments are combined in the right two columns.

