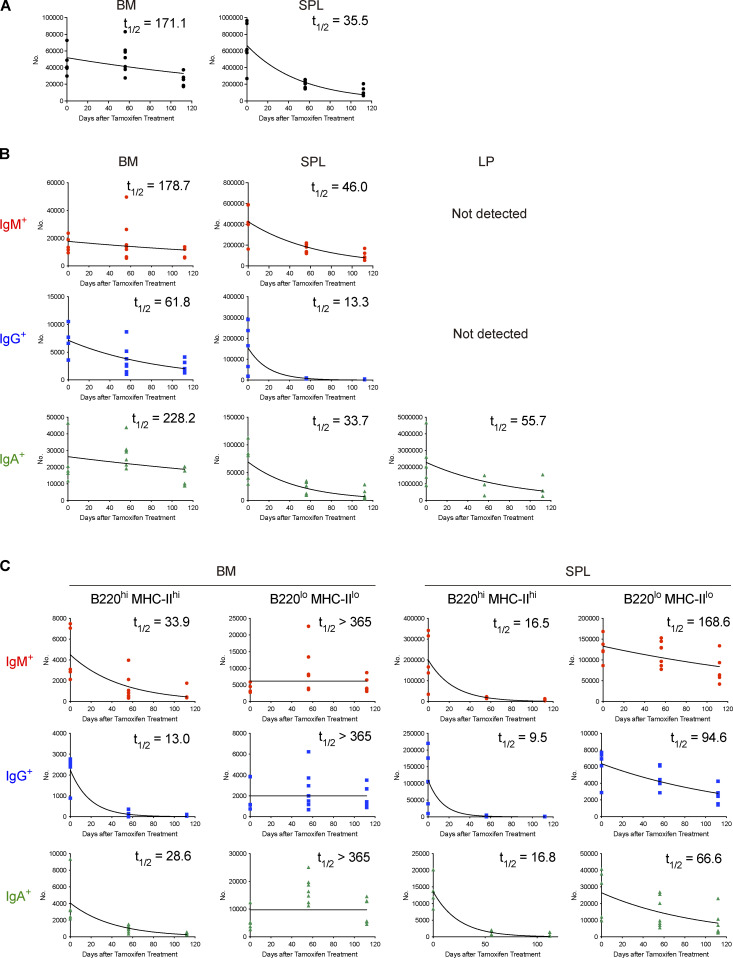
Figure S2.
Half-life of PC populations. (A) Half-lives (t1/2) of tdTomato+ total PCs in BM and SPL calculated from data shown in Fig. 1. Five to seven mice were analyzed at each time point. (B) Half-lives (t1/2) of IgM+, IgG+, and IgA+ tdTomato+ PCs in BM, SPL, and LP calculated from data shown in Fig. 1. Five to seven mice were analyzed at each time point. (C) Half-lives (t1/2) of IgM+, IgG+, and IgA+ tdTomato+ PC subsets (B220hi MHC-IIhi or B220lo MHC-IIlo) in BM and SPL calculated from data shown in Fig. 3. Five to seven mice were analyzed at each time point. Data collected from six independent experiments are combined for calculation of PC half-lives.

