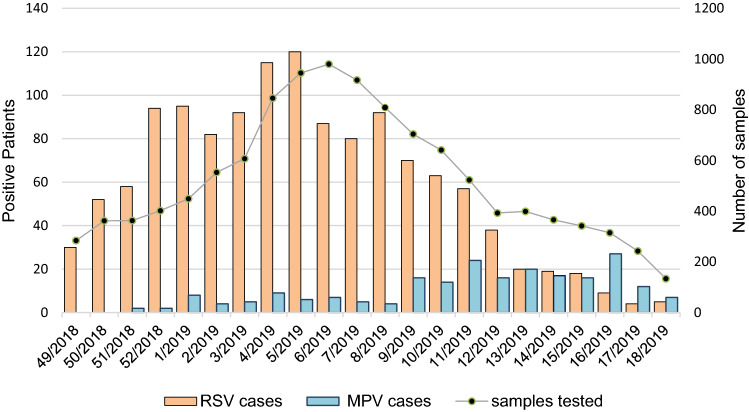
Fig. 1.
Weekly distribution of the total number of tested respiratory samples, the respiratory syncytial virus (RSV) and human metapneumovirus (HMPV)-positive cases. On the X-axis, the calendar week of the study period (December 2018–April 2019) is represented; on the left Y-axis, the number of RSV and HMPV-positive patients and on the right Y-axis, the total number of samples tested by the GLIViRe centers are reported

