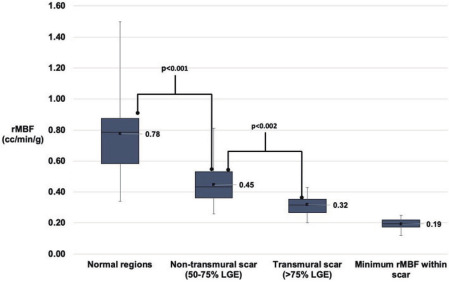
Figure 2 Resting myocardial blood flow within normal myocardium and scar.
Box and whisker plots of resting myocardial blood flow in normal and scarred myocardium and minimum resting flow within scar. Non-transmural scar corresponds to regions of 50-75% LGE whereas transmural scar corresponds to regions with >75% LGE
