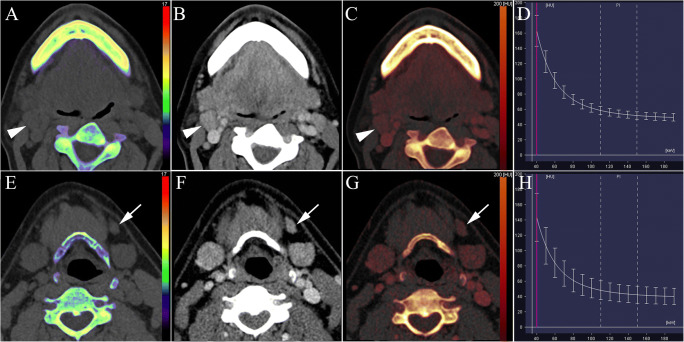
Fig. 1.
Reconstructed dual-energy images and measurement of quantitative parameters. Unenhanced electron density/Zeff map (A), linear blending image at HU40keV (B), iodine concentration map at parenchymal phase (C), and energy spectrum curve (D) of a visually metastatic lymph node (arrowhead). Dual-energy parameters and pathologic analysis indicated non-metastasis. Unenhanced electron density/Zeff map (E), linear blending image at HU40keV (F), iodine concentration map at parenchymal phase (G), and energy spectrum curve (H) of a visually non-metastatic lymph node (arrow). Dual-energy parameters and pathologic analysis indicated metastasis

