Figure 2.
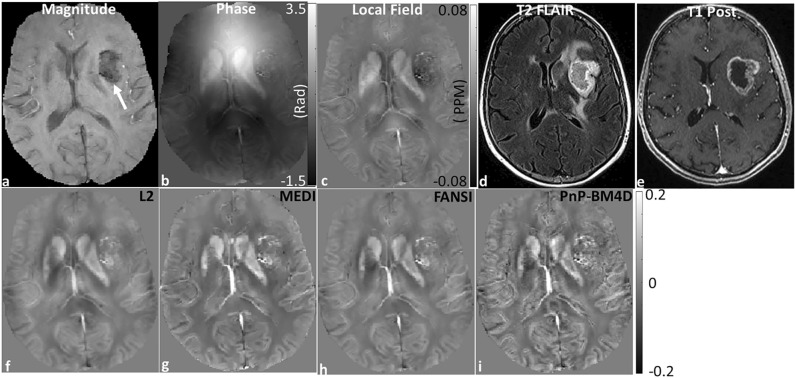
Reconstruction of susceptibility maps from a patient with GBM. (a) The glioblastoma appears hypointense in the T2*-weighted magnitude image (white arrow). The corresponding (b) phase image, (c) local field map, (d) T2 FLAIR and (e) T1 Post contrast image are displayed. QSM reconstructions from (f) closed form L2, (g) MEDI, (h) FANSI, and (i) PnP-BM4D are shown. Tumor features are more conspicuous and show less blurring of vascularity in the PnP-BM4D reconstructions. Additionally, there is less blurring and higher contrast in grey matter cortical regions.

