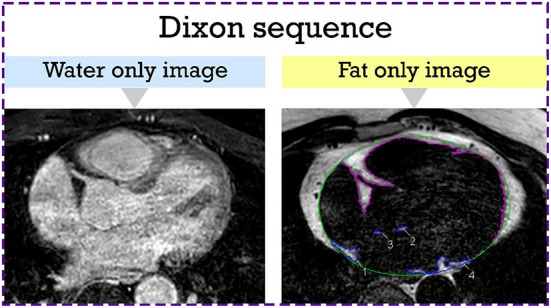
Figure 1.

Epicardial adipose tissue segmentation from the axial Dixon MRI sequence. Hyperintense regions around the LA which represent LA EAT are manually contoured in blue. The rest of the EAT is contoured in purple. The pericardium is outlined in green. EAT, epicardial adipose tissue; LA, left atrial.
