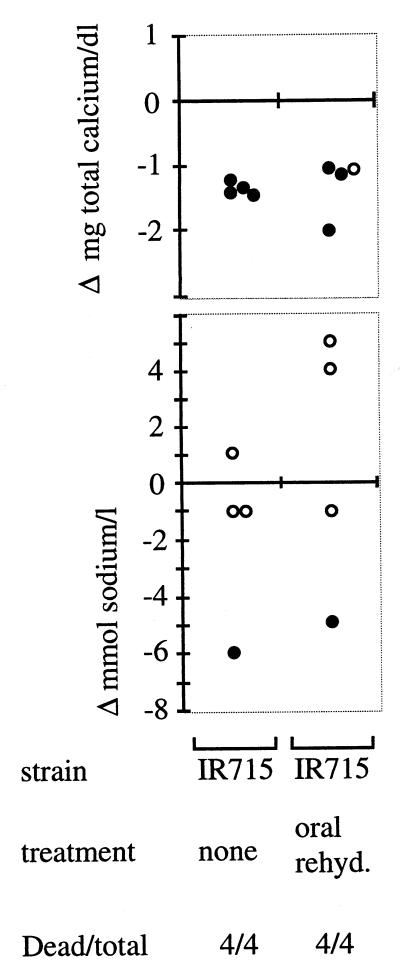
FIG. 3.
Effect of oral rehydration therapy on plasma concentrations of total calcium (top) and sodium (bottom). Graphs show the difference in the plasma concentrations determined for samples collected 1 day postinfection relative to a preinfection sample. Each circle represents data from an individual animal. Open circles indicate plasma values which were within the normal range of 133 to 143 mM (sodium) or 9.1 to 10.6 mg/dl (total calcium); closed circles indicate plasma values outside the normal range.

