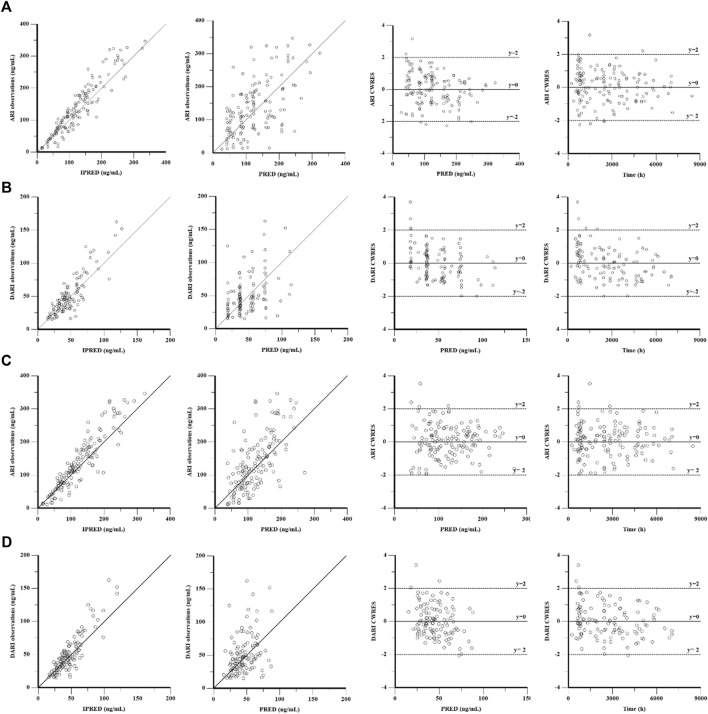
FIGURE 1.
Goodness-of-fit plot of the base model and final population pharmacokinetics model for ARI (A,C) and DARI (B,D). From left to right, the plots are observations against individual predictions (IPRED), observations against population predictions (PRED), conditional weighted residuals (CWRES) against PRED, and CWRES against time, respectively.

