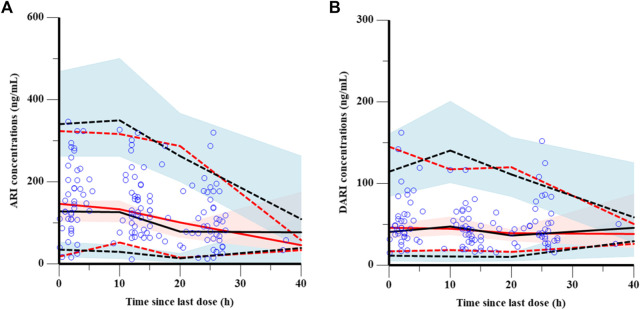
FIGURE 2.
Visual prediction checks of the final model for ARI (A) and DARI (B). The blue points represent the observed value. The dashed and solid red lines are the 5th percentile, 95th percentile and the median of the observed concentrations, respectively. The dashed and solid black lines are the 5th percentile, 95th percentile and the median of the simulated concentrations, respectively. The shaded areas represent the 90% predicted intervals of the 5th, 50th and 95th percentiles of the simulated data, respectively.

