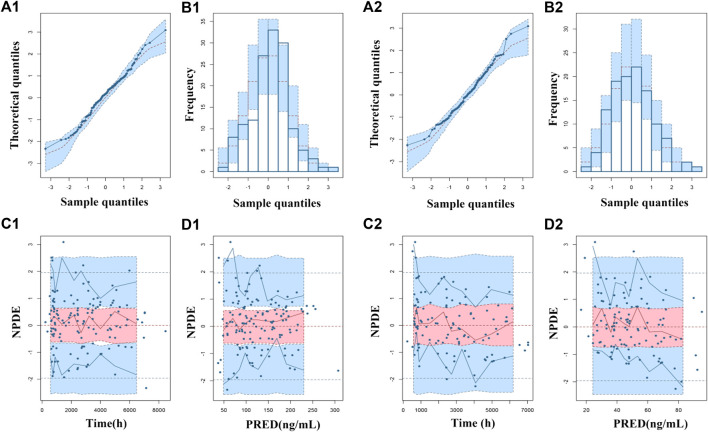
FIGURE 3.
Normalized prediction distribution errors (NPDEs) of the final population pharmacokinetic model for ARI (1) and DARI (2). (A1,A2) Quantile-quantile plot vs. the expected standard normal distribution for ARI and DARI; (B1,B2) Histogram of NPDE with the density of the standard normal distribution overlaid; (C1,C2) Scatterplot of NPDE against time; (D1,D2) Scatterplot of NPDE against PRED.

