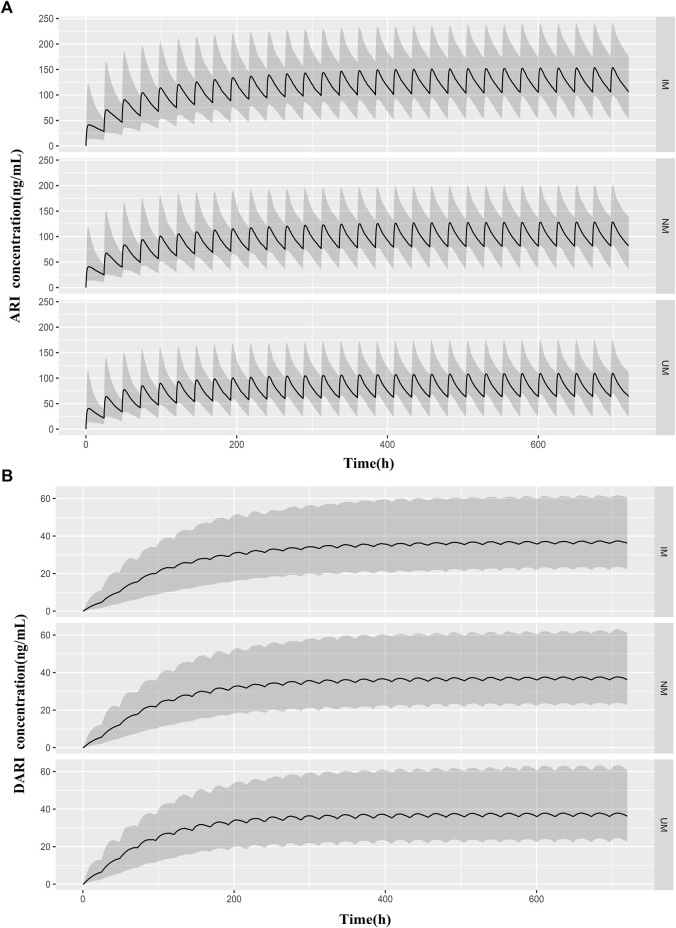
FIGURE 5.
Predicted pharmacokinetic profiles of ARI (A) and DARI (B) during the first 20 days of treatment obtained from IMs, NMs, and UMs. The median body weight of 36 kg and the median dose of 0.5 mg were applied to simulated. The black line is the median of the simulated concentrations. The grey shaded area represents the prediction interval (10th-90th percentiles).

