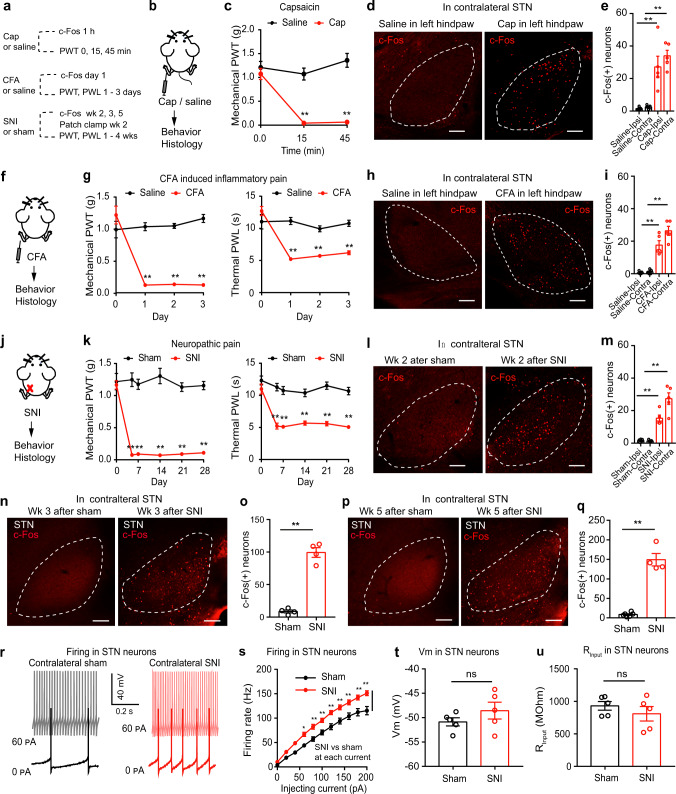
Fig. 1. STN neurons are activated in pain-like behaviors.
a Experimental diagram. b, c Pain development evoked by capsaicin. c PWT: F(2, 36) = 16.62, P < 0.001; n = 7 per group. d, e Example images (d) and quantification (e) of c-Fos-positive neuron after saline or capsaicin (Cap). F(3, 16) = 20.09, P < 0.0001; n = 5 per group. f, g Pain development after CFA injection. PWT: F(3, 44) = 29.31, P < 0.001; PWL: F(3, 44) = 17.67, P < 0.0001; n ≥ 6 per group. h, i Example images (h) and quantification (i) of c-Fos-positive neurons after saline or CFA. F(3, 16) = 42.17, P < 0.0001; n = 5 per group. j, k Pain development after SNI. k PWT: F(5, 78) = 21.23, P < 0.0001; PWL: F(5, 78) = 6.12, P < 0.0001; n ≥ 7 per group. l, m Example images (l) and quantification (m) of c-Fos-positive neurons in week 2 after sham or SNI (F(3, 16) = 37.97, P < 0.0001; n = 5 per group). n–q Example images (n, p) and quantification (o, q) of c-Fos-positive neurons after sham or SNI on the contralateral side (n ≥ 4 per group). o t = 11.56, P < 0.0001; q t = 10.94, P < 0.0001. r–u Example traces (r), evoked firing (s), resting membrane potential (Vm) (t) and input resistance (Rinput) (u) in contralateral STN neurons in week 2 after sham or SNI. s F(1, 214) = 128.9, P < 0.0001, n = 4 per group. t t = 1.21, P = 0.26, n = 5 per group. u t = 0.96, P = 0.37. n = 5 per group. **P < 0.01; Two-way ANOVA with Tukey’s post-hoc analysis for (c, g, k and s); One-way ANOVA with Tukey’s post-hoc analysis for (e, i and m); Two-tailed unpaired t test for (o, q, t, and u). Data are presented as mean ± SEM. Scale bars: 100 µm.

