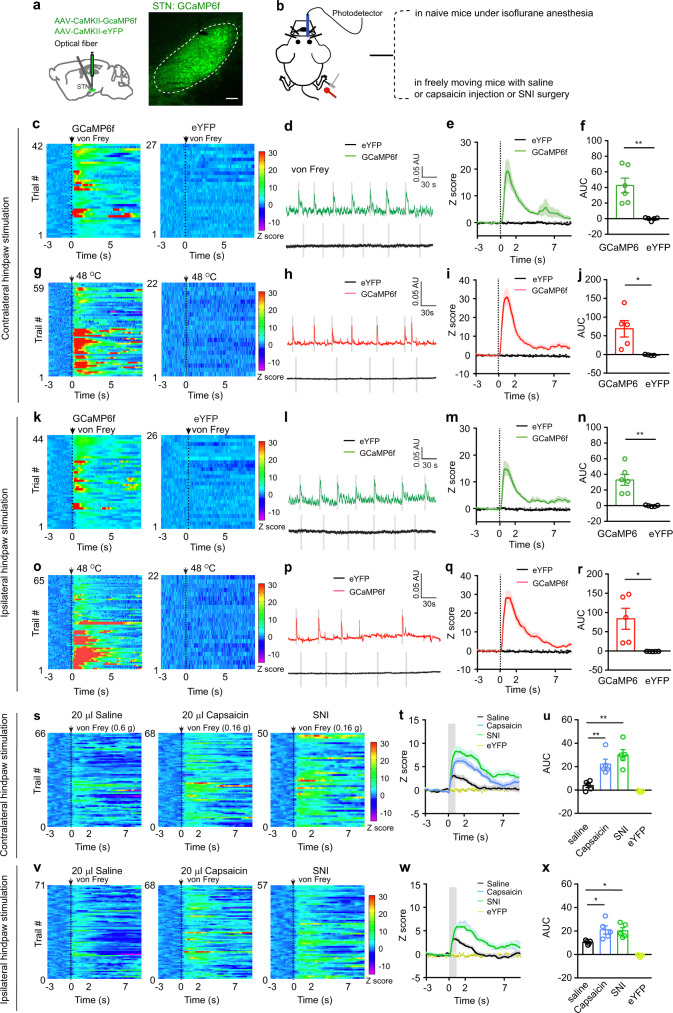
Fig. 2. Dynamics of STN GCaMP6 signal in pain processing.
a Experimental diagram and example image of GCaMP6f in the STN. b Experimental diagram for GCaMP6 recordings. c–j Heat maps (c, g), example traces (d, h), averaged normalized traces (e, i), and quantification (f, j, area under the curves (AUC) in panels e and i) of changes in GCaMP6f and eYFP signals in mice receiving von Frey or heat stimulation on the contralateral hind paw. f t = 4.12, p = 0.0026, n ≥ 5 per group; j t = 3.16, p = 0.014, n = 5 per group. k–r Heat maps (k, o), example traces (l, p), averaged normalized traces (m, q), and quantification (n and r, AUC in panels m and q) of changes in GCaMP6f and eYFP signals in mice receiving von Frey or heat stimulation on the ipsilateral hind paw. n t = 4.33, p = 0.0019, n ≥ 5 per group. r t = 3.12, p = 0.014, n = 5 per group. s–x Heat maps (s, v), averaged normalized traces (t, w), and quantification (u and x, AUC in panels t and w) of changes in GCaMP6f and eYFP signals following von Frey stimulation of the contralateral and ipsilateral hind paw in mice receiving saline or capsaicin injection in lower hind leg (30 min) or SNI surgery (2 weeks). u F(3, 16) = 21.13, p < 0.0001. x F(3, 15) = 21.6, p < 0.0001. n = 5 per group. **P < 0.01; Two-tailed unpaired t test for (f, j, n, and r); One-way ANOVA with Tukey’s post-hoc analysis for (u) and (x). Data are presented as mean ± SEM. AU in panels (d, h, l and p) stands for arbitrary unit of fluorescence intensity. Scale bar: 100 µm.

