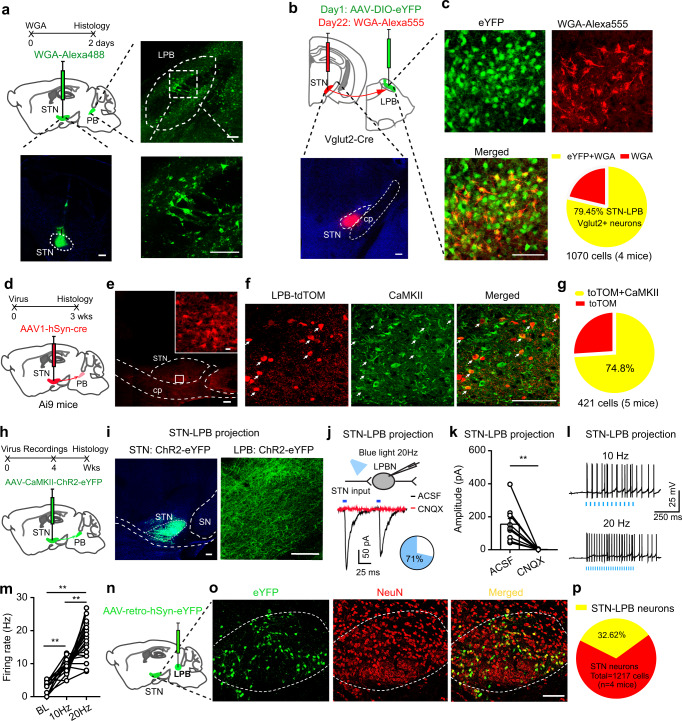
Fig. 3. STNGlu neurons directly innervate LPBGlu neurons.
a Anterograde labeling of lateral parabrachial nucleus (LPB) neurons from the STN. b Experimental diagram for labeling LPB glutamatergic neurons (upper) and an example image showing the WGA injection in the STN (lower). c Colocalization of WGA and Vglut2 in LPB neurons and the quantification pie chart. d Anterograde labeling of LPB neurons from the STN with scAAV1-hSyn-Cre. e Example images of an AAV1-Cre injection site in the STN. f–g Colocalization of tdTomato (tdTOM) and CaMKII in the LPB (f, representative images; g, quantification). h, i Viral vector was injected in the STN to label STN neuronal somata and projections to the LPB (h, schematic diagram; i, example images). j Whole-cell patch-clamp recordings were performed to record postsynaptic currents in LPB neurons evoked by paired pulses of 5 ms blue light stimulation (50 ms interval, 2 mW). The photo-EPSCs were blocked by 20 µM CNQX (trace in red). The pie chart indicates the percentage of responding neurons (blue). k Quantification of photo-EPSC amplitude in the absence and presence of CNOX (t = 4.16, P = 0.003, n = 3 mice (9 neurons) per group). l, m Corresponding firing response to 10 and 20 Hz blue light stimulation (m, F (1.35, 21.53) = 59.23, P < 0.0001, n = 3 mice (17 neurons). n Experimental diagram of retrograde labeling of STN neurons from the LPB. o, p Example images (o) and quantification (p) of STN–LPB-projection neurons. Neurons were counted in 10 sections from 4 mice. **P < 0.01; Two-tailed paired t test for (k). one-way ANOVA with Tukey’s post-hoc analysis for (m). Data are presented as mean ± SEM. scale bars: 100 µm, except for that in the inset of panel (e) (10 µm).

