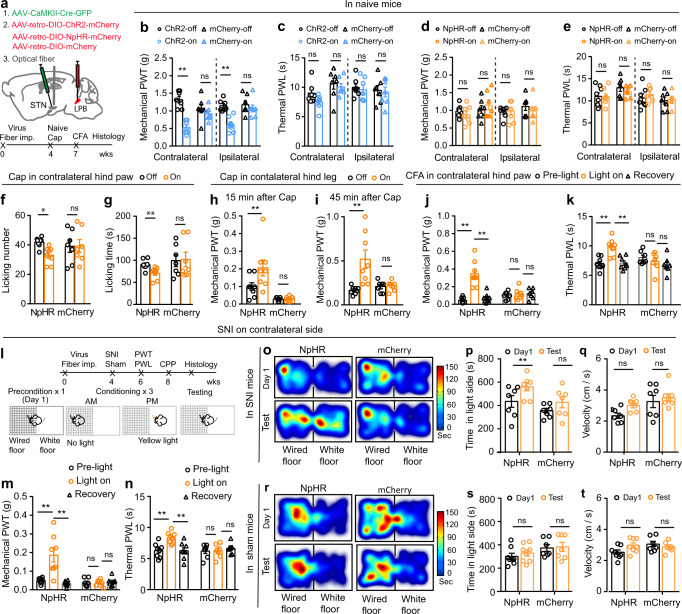
Fig. 4. STN–LPB neurons modulate pain-like behaviors.
a Experimental diagram for optogenetic manipulation of STN–LPB neurons. Timeline for panel (b–k). b–e Effect of activation or inhibition of STN–LPB neurons on pain thresholds in naive mice. b F(1, 24) = 35.4, P < 0.0001. c F(1, 24) = 2.98, P = 0.1. d F(1, 24) = 0.077, P = 0.78). e F(1, 25) = 0.029, P = 0.87; n ≥ 7 per group. f–g Effect of silencing of STN–LPB neurons on the frequency (f, F(1, 13) = 7.57, P = 0.01) and duration (g, F(1, 13) = 5.46, P = 0.03) of nocifensive behavior induced by hind paw injection of capsaicin. n ≥ 7 per group. h, i Effect of silencing of STN–LPB neurons on PWT 15 min (h, F(1, 13) = 5.53, P = 0.035) and 45 min (i, F(1,13) = 7.70, P = 0.016) after hind leg injection of capsaicin. n ≥ 7 per group. j, k Effect of silencing of STN–LPB neurons on PWT (j, F(2, 26) = 30.27, P < 0.0001) and PWL (k, F(2, 26) = 14.09, P = 0.0003) in CFA mice. n ≥ 7 per group. l Timeline and experimental diagram for panels (m–t). m, n Effect of silencing of STN–LPB neurons on PWT (m, F(2, 26) = 14.25, P < 0.0001) and PWL (n, F(2, 26) = 14.04, P = 0.0001) 2 weeks after SNI. n ≥ 7 per group. o–t Representative heat maps (o, r), time spent (p, s) and velocity (q, t) in the yellow-light-paired chamber in the pre-test and test session for SNI and sham (n ≥ 7 per group) mice. p F(1, 12) = 14.72, P = 0.0024. q F(1, 12) = 4.28, P = 0.061. s F(1, 13) = 0.65, P = 0.44. t F(1, 13) = 1.03, P = 0.33. *P < 0.05. **P < 0.01; Two-way ANOVA with Tukey’s post-hoc analysis for (b–k, m, n, p, q, s and t). Data are presented as mean ± SEM.

