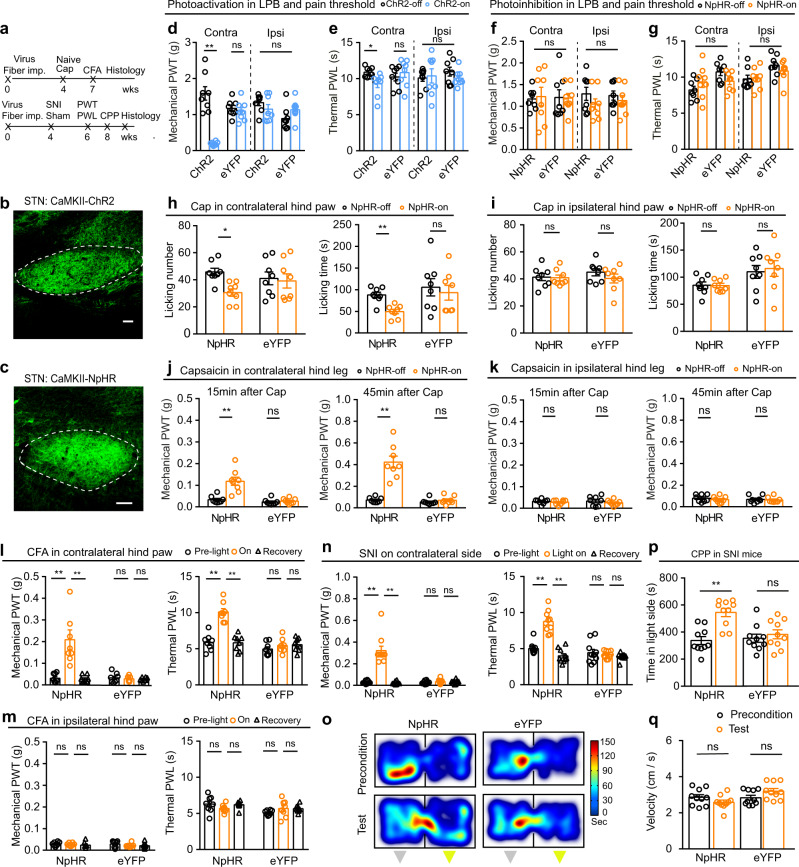
Fig. 7. The STN–LPB projection modulates pain-like behaviors in female mice.
a Timeline of experimental setup. b, c Example images of ChR2 (b) and NpHR (c) expressions in the STN. d–g Effect of activation or inhibition of the STN–LPB projection on pain thresholds (n = 8 per group). d F(1, 28) = 20.8, P < 0.0001; e F(1, 28) = 1.19, P = 0.28; f F(1, 28) = 0.57, P = 0.46; g F(1, 28) = 0.51, P = 0.48. h, i Effect of silencing of the STN–LPB projection on nocifensive behavior induced by capsaicin injection into hind paws (n = 8 per group). h Left, F(1, 14) = 5.35, P = 0.03; Right, F(1, 14) = 7.88, P = 0.01. i Left, F(1, 14) = 0.88, P = 0.36; Right, F(1, 14) = 0.18, P = 0.68. j, k Effect of silencing of the STN–LPB projection on PWT induced by Cap injection into hind legs (n = 8 per group). j Left, F(1, 14) = 23.6, P = 0.0003; Right, F(1, 14) = 29.3, P < 0.0001. k Left: F(1, 14) = 0.15, P = 0.70; Right, F(1, 14) = 0.11, P = 0.75. l, m Effect of silencing of the STN–LPB projection on pain threshold in CFA mice (n = 8 per group). l Left, F(2, 28) = 17.47, P < 0.0001; Right, F(2, 28) = 20.2, P < 0.0001. m Left, F(2, 28) = 0.17, P = 0.84; Right, F(2, 28) = 2.37, P = 0.11. n Effect of silencing of the STN–LPB projection on pain thresholds 2 weeks after SNI. Left, F(2, 36) = 50.73, P < 0.0001; Right, F(2, 36) = 43.08, P < 0.0001; n = 10 per group. o–q Silencing of the STN–LPB projection induced CPP (n = 10 per group). p F(1, 18) = 9.69, P = 0.006; q F(1, 18) = 0.15, P = 0.7. Gray and yellow triangles in panel (o) represent no light and yellow light presented in the chamber during the conditioning session, respectively. **P < 0.01; Two-way ANOVA with Tukey’s post-hoc analysis for (d–n, p, and q). Data are presented as mean ± SEM. Scale bars: 100 μm.

