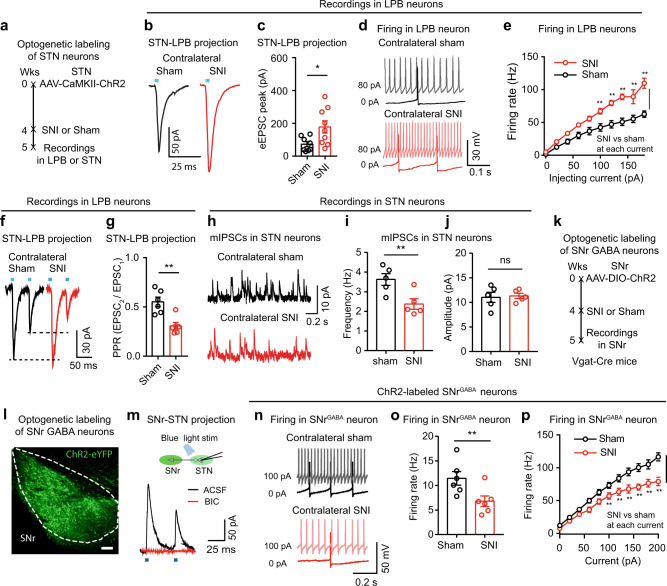
Fig. 8. Modification of STNGlu–LPBGlu projection in neuropathic pain.
a Timeline of experiments for panels (b–j). b, c Example traces (b) and peak amplitude (c) of blue light (5 ms, 2 mW)-evoked photo-EPSCs in LPB neurons from sham and SNI mice. c t = 2.49, P = 0.025, n = 9 per group. d, e Example traces (d) and evoked firing (e) in LPB neurons in week 2 after sham or SNI. Group: F(1, 175) = 100.1, P < 0.0001. f–g Example traces (f) and paired-pulse ratio (PPR) (g) of blue light (5 ms, 2 mW, 50 ms interval)-evoked photo-EPSCs recorded in LPB neurons in slices from sham and SNI mice. g t = 4.15, P = 0.002, n = 6 per group. h–j Example traces (h) and quantification (i, j) of mIPSCs in STN neurons in week 2 after sham or SNI (n = 5 per group). Frequency (i): t = 3.1, P = 0.011; Amplitude (j): t = 0.24, P = 0.82. k Timeline of experiments for recording from SNrGABA neurons in sham and SNI mice. l Example image showing ChR2-eYFP expression in Vgat(+) neurons in the SNr. m Whole-cell patch clamp recording of blue light-evoked photo-currents in STN neurons (top). Photo-currents in STN neurons (bottom) were blocked by 10 µM bicuculline (BIC), a GABAA receptor blocker. n Firing recorded from SNrGABA neurons in week 2 after sham or SNI on the contralateral side. o, p Summary of spontaneous (o) and evoked firing (p) recorded from SNrGABA neurons from sham (n = 6, 13 cells) and SNI (n = 6, 16 cells) mice. o t = 2.33, P = 0.027. p Group: F(1, 234) = 94.93, P < 0.0001. *P < 0.05, **P < 0.01; Two-tailed t test for (c, g, i, j and o); Two-way ANOVA with Tukey’s post-hoc analysis for (e and p). Data are presented as mean ± SEM. Scale bar: 100 µm.

