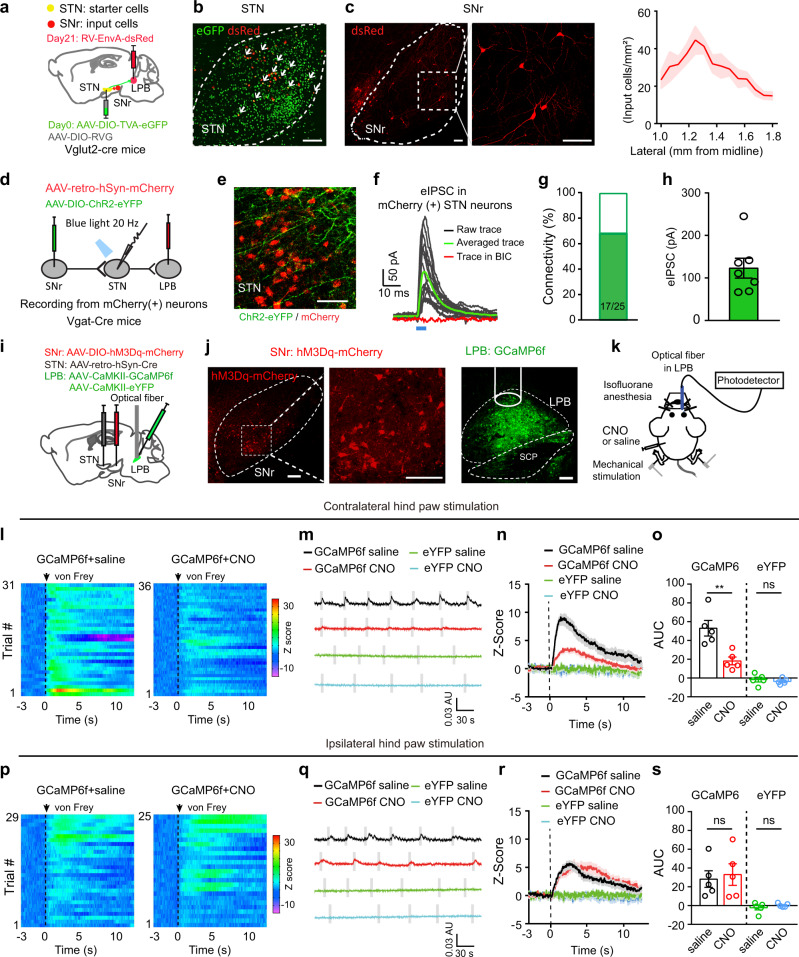
Fig. 9. Connectivity of the SNrGABA–STNGlu–LPBGlu pathway.
a Experimental diagram of Cre-dependent monosynaptic retrograde rabies virus tracing. b Example images of viral expression in the STN. Starter cells (white arrows) co-expressing AAV-DIO-TVA-eGFP (green) and RV-EnvA-ΔG-DsRed (red). c Example images and quantification (n = 5 mice) of DsRed-labeled neurons in the SNr traced from LPB-projecting STN neurons. d Experimental diagram of patch clamp recording of STN–LPB neurons with blue light stimulation of ChR2-labeled SNr terminals in the STN. e mCherry-labeled STN neurons were surrounded by ChR2-labeled SNr terminals. f Blue light-evoked currents in mCherry(+) STN neurons were blocked by BIC (n = 7 mice). g Bar graph showing the percentage of responding neurons recorded in (e). h Amplitude of photo-IPSCs in mCherry(+) STN neurons (n = 7 mice). i Experimental diagram of virus injections. j Example images of hM3Dq and GCaMP6f expression at the injection sites. k Experimental diagram of GCaMP6f signal recordings in response to bilateral von Frey stimulation (4 g) of the hind paws and chemogenetic activation of STN-projecting SNr neurons with CNO (i.p., 3 mg/kg). CNO was applied 45 min prior to GCaMP6f signal recording. l–s Heat maps (l, p), example traces (m, q), average traces (n, r), and quantification (o, s, AUC in panels n, r) of GCaMP6f response in the LPB of mice receiving von Frey stimulation of hind paws after i.p. administration of saline or CNO. o F(1.8) = 13.36, p = 0.007. s F(1,8) = 1.69, p = 0.023; n = 5 per group. **P < 0.01; Two-way ANOVA with Tukey’s post-hoc analysis for (o) and (s). Data are presented as mean ± SEM. AU in panels (m) and (q) stands for arbitrary unit of fluorescence intensity. Scale bars: 100 µm.

