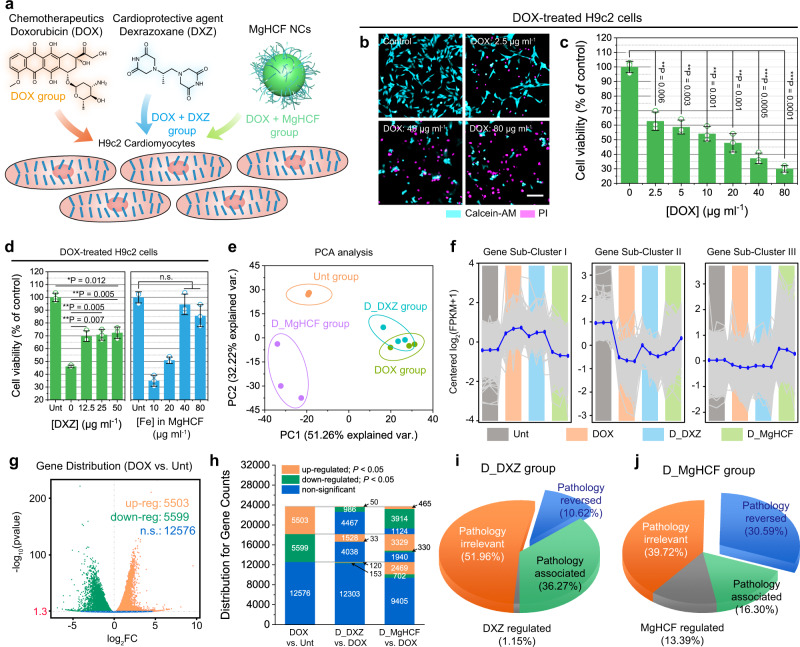
Fig. 4. In vitro cellular evaluations and high throughput mRNA sequencing.
a Schematic illustration of the in vitro cellular experiments. b Confocal microscopic images of Calcein-AM/PI-stained cells treated with varying doses of DOX. Scale bar: 50 μm. c Viability of H9c2 cells treated with varying doses of DOX (n = 3 of biological replicates). Data are presented as mean ± s.d. Statistical significance is assessed by Student t’s one-tailed test. **P < 0.01, ***P < 0.001. d Viability of the H9c2 cells treated with DOX supplemented with different concentrations of DXZ or MgHCF (n = 3 of biological replicates). Data are presented as mean ± s.d. Statistical significance is assessed by Student t’s one-tailed test. *P < 0.05, **P < 0.01. n.s. for non-significant. e PCA analysis for the cell samples in different groups. Data are presented as they are. f Sub-clustering indications (by H-clustering method) for the mRNA whole genetic regulation distributions within cells in different groups. Data are presented as they are with the mean value shown in blue. g Volcano plots for the DEG distributions between DOX and Unt groups in terms of up-regulated, down-regulated, and non-significant genes. Significant tests are based on the negative binomial distribution. *P < 0.05 is equivalent to the −log10(pvalue) >1.3. Data are presented as they are. h Distributions of gene counts in DOX vs. Unt for pairwise comparisons between D_MgHCF and DOX, and between D_DXZ and DOX. i and j Gene percentages for D_DXZ group (i) and D_MgHCF group (j) following gene grouping.

