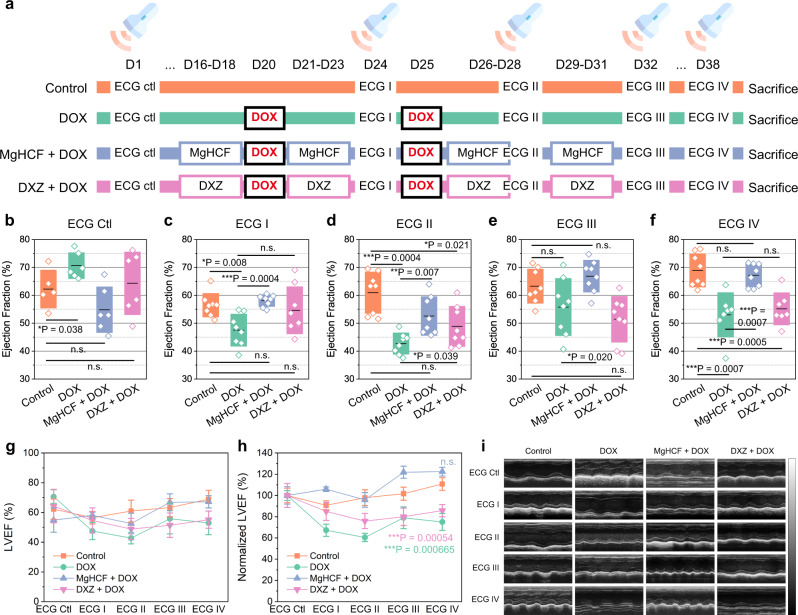
Fig. 7. In vivo echocardiography evaluation.
a In vivo dosing schedule for in vivo echocardiography evaluation. b–f Left ventricular ejection fractions of mice in different groups by echocardiography inspections: b ECG Ctl (n = 6); c ECG I (n = 8); d ECG II (n = 8); e ECG III (n = 8); f ECG IV (n = 8). Data are presented as they are and mean (line) ± s.d. (bounds of box). Statistical significance is assessed by Student t’s two-tailed test. *P < 0.05, **P < 0.01, ***P < 0.001 and n.s. for non-significant. g and h, Raw (g) and normalized LVEF levels (h) of mice by different ECG inspections for different groups. Data are presented as mean ± s.d. Statistical significance (to the control group) is assessed by Student t’s two-tailed test. ***P < 0.001 and n.s. for non-significant. i Representative echocardiographic images for mice in different groups by echocardiography inspections.

