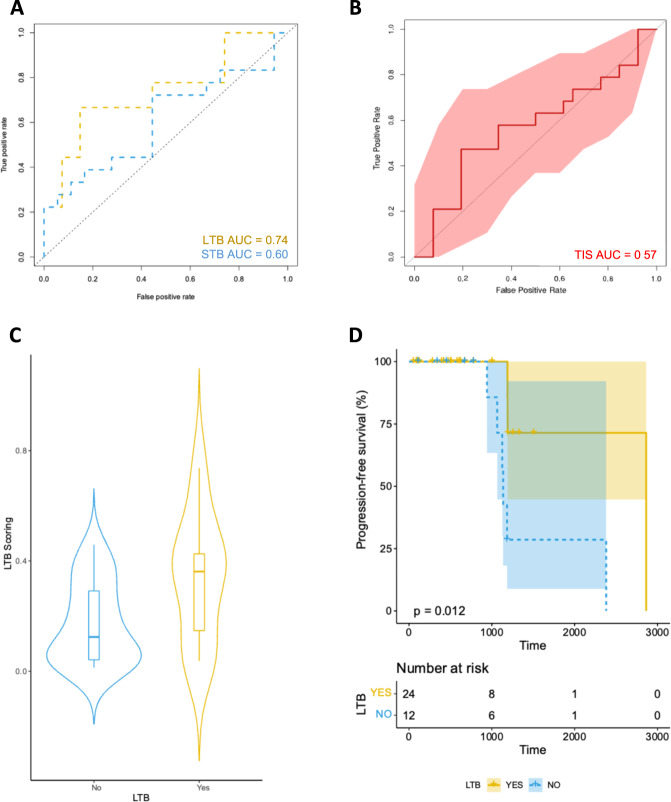
Fig. 5. Validation of the 12-gene signature that predicts LTB from programmed cell death protein 1-based immunotherapies in patients with advanced or metastatic melanoma.
A Receiver operating characteristic curves for LTB and STB signatures in the validation set. B Receiver operating characteristic curves for the TIS signature in the validation set. C Violin plot showing the distribution of scores according to LTB outcome in the validation set. D Kaplan–Meier curve for PFS for patients ranked high according to the 12-gene LTB signature score in the validation set. For the validation set the low subgroup has a minimum score of 0.0001396, 1st quartile of 0.018, median of 0.09, mean of 0.12, 3rd quartile of 0.18 and maximum score of 0.39; the high subgroup has a minimum score of 0.1880, 1st quartile of 0.32, median of 0.7, mean of 0.57, 3rd quartile of 0.74 and maximum score of 0.84. The error bars correspond to the 95% confidence intervals. LTB long-term benefit, STB short-term benefit, AUC area under the curve, PFS progression-free survival.

