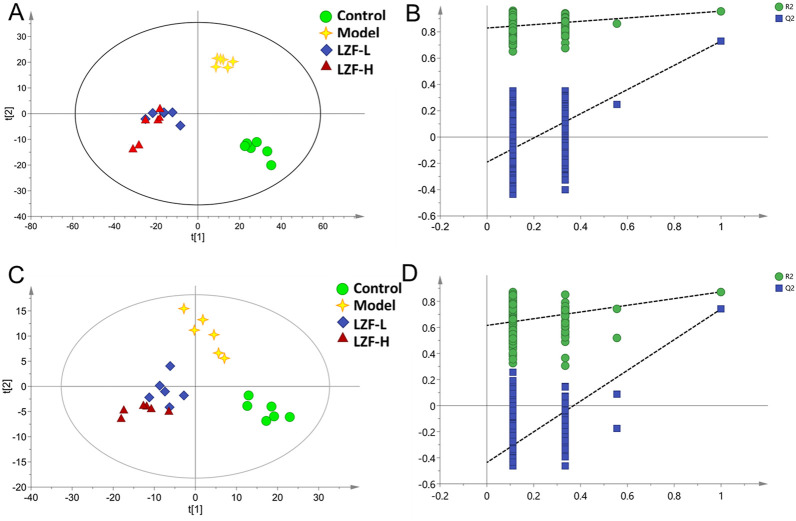
FIGURE 2.
Multivariate statistical analysis of serum mass spectrometry. (A) PLS-DA score plot in the positive ion mode; (B) 200 permutation tests of the PLS-DA score plot in the positive ion mode; (C) PLS-DA score plot in the negative ion mode; and (D) 200 permutation tests of the PLS-DA score plot in the negative ion mode.

