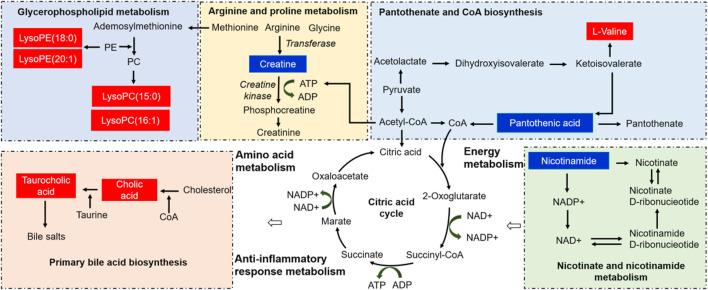
FIGURE 7.
Correlation pathway networks of treatment with LZF solution in TNBS-induced UC. The red and blue represent the metabolites increased and decreased, respectively, compared with the model group. (PC: phosphatidylcholine, PE: phosphatidylethanolamine, LysoPC: lysophosphatidylcholine, LysoPE: lysophosphatidylethanolamine).

