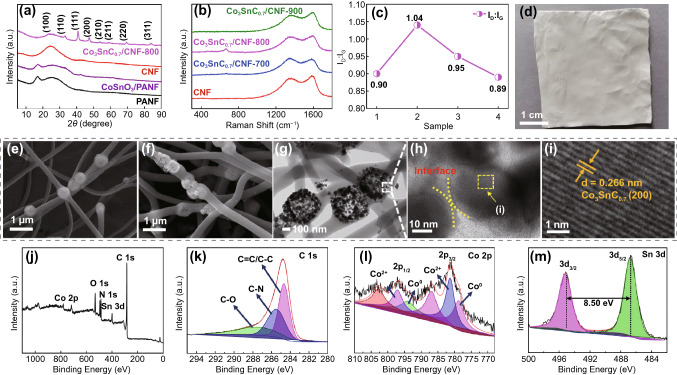
Fig. 2.
The XRD pattern of PANF, CoSnO3/PANF, CNF, and Co3SnC0.7/CNF-800 (a); Raman of CNF (Sample 1) and Co3SnC0.7/CNF-700 (Sample 2), Co3SnC0.7/CNF-800 (Sample 3), and Co3SnC0.7/CNF-900 (Sample 4) (b, c); the digital image of CoSnO3/PANF (d); the SEM images of CoSnO3/PANF (e), Co3SnC0.7/CNF-800 (f); TEM: low (g) and high definition (h) of Co3SnC0.7/CNF-800; XPS spectrum of sample Co3SnC0.7/CNF-800; full spectrum (j); fine spectrum: C 1s (k), Co 2p (l), Sn 3d (m)

